Figures & data
Figure 1. Schematic representation of the three types of intra-luminal thermometry used for temperature and SAR measurements at oesophageal tumour locations. Left: multi-sensor thermocouple probes (TCs) inserted in two opposing lumina of a three-lumen nasogastric tube (configuration C1). Middle: TCs mounted on an inflatable balloon catheter (configuration C2; for clarity only one TC is drawn in the upper picture). Right: TCs inside a three-lumen nasogastric tube or a regular single lumen nasogastric tube and TCs mounted on a balloon catheter used simultaneously (configurations C3 and C4).
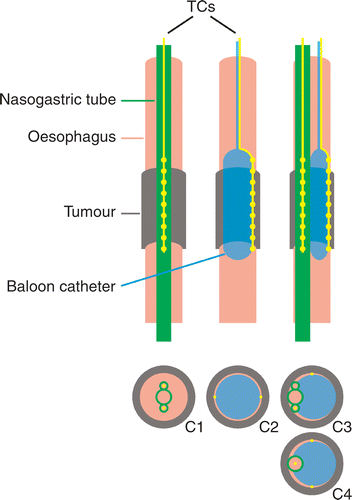
Table I. Overview of the different thermocouple (TC) configurations used in the phase I and phase II study (configuration C1–C4, see ), the number of thermocouple probes used (# TCs), the number of patients (# patients), the number of treatment sessions (# treatment sessions), the type of analysis in which the concerned data were used, and the figure number in which the results were presented.
Figure 2. Typical ΔT profiles along the thermocouple tracks measured simultaneously in a nasogastric tube and with a balloon catheter, in an individual patient with a tumour length of 6 cm.
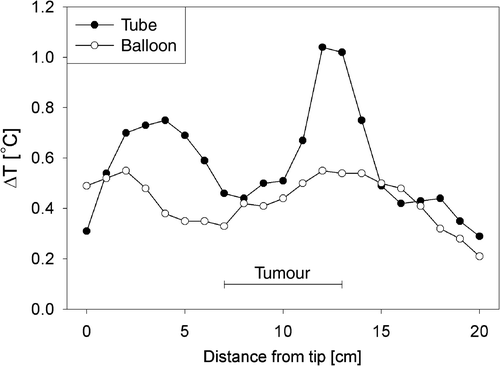
Figure 3. Typical development of temperature profiles along the thermocouple tracks during treatment, measured simultaneously in a nasogastric tube (a) and with a balloon catheter (b), at the start of the treatment, at the start of the steady state period (SST) and at 15, 30, and 60 min of the steady state period. Tumour length was 6 cm.
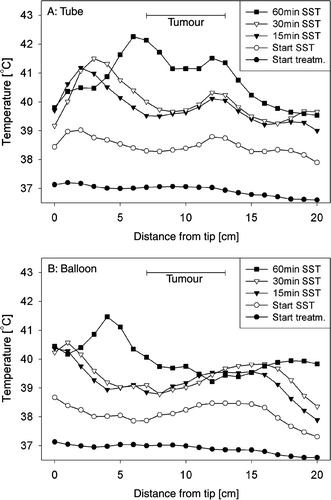
Figure 4. Histograms of the differences in ΔT (a) and temperature (b) measurements between corresponding thermosensors in nasogastric tubes and on balloon catheters.
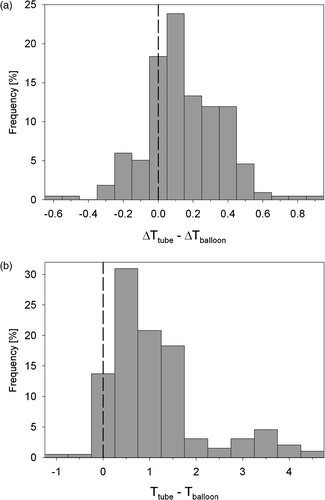
Figure 5. (a) Relation between the temperatures measured in a nasogastric tube (Ttube) and with a balloon catheter (Tballoon) for two different treatment sessions (symbols). The relation between both measurements was described by a linear fit (equation (2)) per treatment session (thick solid lines). The line of unity (upper solid line) and the average relation between Tballoon and Ttube for all 14 treatment sessions (dashed line) are also shown. (b) Relation between Toffset and slope from equation (2) for the 14 treatment sessions.
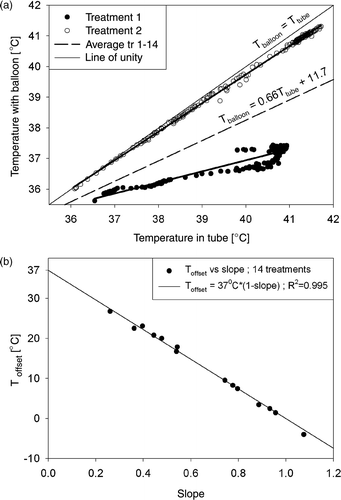
Figure 6. (a) Relation between ΔT and SST for nasogastric tube and balloon catheter measurements. The depicted lines are model fits using equations (4) and (5). (b) Reconstructed perfusion as a function of temperature for tube and balloon catheter measurements, together with the perfusion of tumour and muscle tissue. All curves have been normalized to the values at 37°C. The curves for tumour and muscle perfusion have been reproduced from Song Citation[24].
![Figure 6. (a) Relation between ΔT and SST for nasogastric tube and balloon catheter measurements. The depicted lines are model fits using equations (4) and (5). (b) Reconstructed perfusion as a function of temperature for tube and balloon catheter measurements, together with the perfusion of tumour and muscle tissue. All curves have been normalized to the values at 37°C. The curves for tumour and muscle perfusion have been reproduced from Song Citation[24].](/cms/asset/63f87c63-4eb1-4458-b93b-5ea16de47d89/ihyt_a_193093_f0006_b.gif)
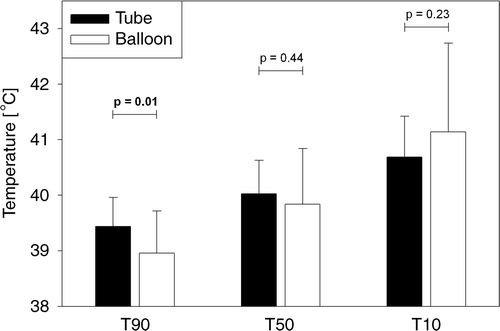
Figure 7. Tumour temperatures measured with nasogastric tubes (20 treatments) or balloon catheters (45 treatments), quantified by T90, T50 and T10 (minimal, mean and maximal temperature, respectively), averaged over all treatments of the phase I study (mean ± SD). The difference between tube and balloon measurements was significant for T90.
