556
Views
18
CrossRef citations to date
0
Altmetric
Original

Induction of apoptosis by heat and γ-radiation in a human lymphoid cell line; role of mitochondrial changes and caspase activation

, , &
Pages 687-698 | Received 13 Apr 2006, Accepted 27 Sep 2006, Published online: 09 Jul 2009

Figures & data

Figure 1. Kinetics of Δψm transition, caspase activation and PS exposure associated with heat- and radiation-induced apoptosis of HL60 cells. HL60 cells were exposed to 43°C during 1 h (HT) or to 8 Gy γ-radiation (RT). Figures show the percentage of cells, within the total population of 10 000 counted cells, showing fluorescence. (a) Reduction of Δψm determined by the extent of mitochondrial JC-1 uptake. JC-1 monomers represent a decreased Δψm, whereas with a normal Δψm, JC-1 aggregates in mitochondria to a crystalline structure. At the indicated time, the percentage of cells with JC-1 monomer fluorescence were determined with the flow-cytometer. (b) Percentage of cells with activated caspases determined using FLICA. (c) The percentage of cells with PS exposed to the outer leaflet of the cell membrane determined with Annexin V-FITC binding to PS. The results are the mean ± SD (n = 3).
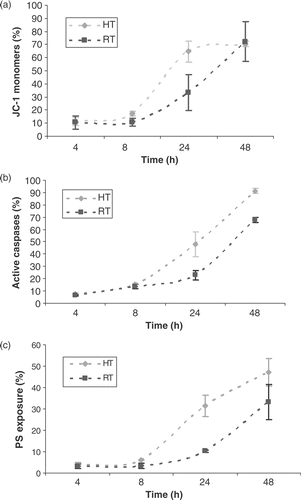
Figure 1. Kinetics of Δψm transition, caspase activation and PS exposure associated with heat- and radiation-induced apoptosis of HL60 cells. HL60 cells were exposed to 43°C during 1 h (HT) or to 8 Gy γ-radiation (RT). Figures show the percentage of cells, within the total population of 10 000 counted cells, showing fluorescence. (a) Reduction of Δψm determined by the extent of mitochondrial JC-1 uptake. JC-1 monomers represent a decreased Δψm, whereas with a normal Δψm, JC-1 aggregates in mitochondria to a crystalline structure. At the indicated time, the percentage of cells with JC-1 monomer fluorescence were determined with the flow-cytometer. (b) Percentage of cells with activated caspases determined using FLICA. (c) The percentage of cells with PS exposed to the outer leaflet of the cell membrane determined with Annexin V-FITC binding to PS. The results are the mean ± SD (n = 3).

Figure 2. Intra-cellular Bcl-2 and Bax protein levels. (a) Percentage decrease in mean fluorescent ratio (MFR) of Bcl-2, compared to MFR of Bcl-2 for untreated HL60 cells, 1 and 2 h after heat-treatment (HT; 43°C during 1 h) or γ-irradiation (RT; 8 Gy). (b) Percentage increase in MFR of Bax, compared to MFR of Bax for untreated HL60 cells, 1 and 2 h after heat-treatment (HT) or γ-irradiation (RT). The MFR, defined as the ratio of the mean fluorescent intensity (MFI) of primary antibody and the MFI of the isotype control stained cells, was used as a measure for Bcl-2 or Bax protein expression. The results are the mean ± SD (n = 3).
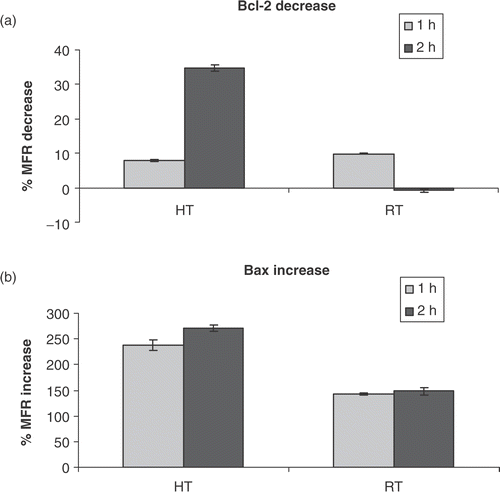
Figure 2. Intra-cellular Bcl-2 and Bax protein levels. (a) Percentage decrease in mean fluorescent ratio (MFR) of Bcl-2, compared to MFR of Bcl-2 for untreated HL60 cells, 1 and 2 h after heat-treatment (HT; 43°C during 1 h) or γ-irradiation (RT; 8 Gy). (b) Percentage increase in MFR of Bax, compared to MFR of Bax for untreated HL60 cells, 1 and 2 h after heat-treatment (HT) or γ-irradiation (RT). The MFR, defined as the ratio of the mean fluorescent intensity (MFI) of primary antibody and the MFI of the isotype control stained cells, was used as a measure for Bcl-2 or Bax protein expression. The results are the mean ± SD (n = 3).

Figure 3. The apoptotic rate after heat-treatment (HT; 43°C during 1 h) and γ-radiation (RT; 8 Gy). The percentage of viable, early and late apoptotic cells are shown. Figures show the percentage of cells, within the total population of 10 000 counted cells, showing fluorescence. The different cell populations based on FLICA and PI uptake were plotted as a function of time after heat-treatment (a) or γ-irradiation (b) of HL60 cells in the continuous presence of FLICA. The fraction of viable cells is FLICA and PI, determined with the flow-cytometer as described in materials and methods. Early apoptotic cells are FLICA+ and PI. In the late stage of apoptosis cells loose plasma membrane integrity and become FLICA+ and PI+. The results are the mean ± SD (n = 3).
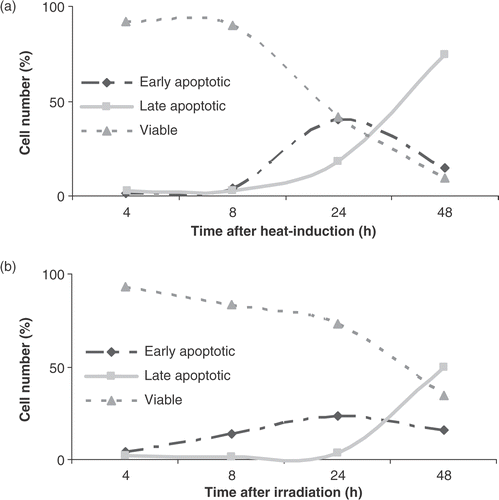
Figure 3. The apoptotic rate after heat-treatment (HT; 43°C during 1 h) and γ-radiation (RT; 8 Gy). The percentage of viable, early and late apoptotic cells are shown. Figures show the percentage of cells, within the total population of 10 000 counted cells, showing fluorescence. The different cell populations based on FLICA and PI uptake were plotted as a function of time after heat-treatment (a) or γ-irradiation (b) of HL60 cells in the continuous presence of FLICA. The fraction of viable cells is FLICA− and PI−, determined with the flow-cytometer as described in materials and methods. Early apoptotic cells are FLICA+ and PI−. In the late stage of apoptosis cells loose plasma membrane integrity and become FLICA+ and PI+. The results are the mean ± SD (n = 3).

Figure 4. Effect of pan-caspase inhibitor zVAD-fmk on Δψm disruption and PS exposure. HL60 cells were treated with heat (HT; 43°C during 1 h) or γ-radiation (RT; 8 Gy) in the presence (+) or absence (−) of 20 µM zVAD-fmk. Figures show the percentage of cells, within the total population of 10 000 counted cells, showing fluorescence. (a) Percentage of cells with JC-1 monomers after 24 h, correlating with a depolarized mitochondrial membrane potential. (b) Percentage of cells that show PS exposure 48 h after induction of apoptosis. zVAD-fmk was added before induction of apoptosis and was continuously present. The results are the mean ± SD (n = 3).
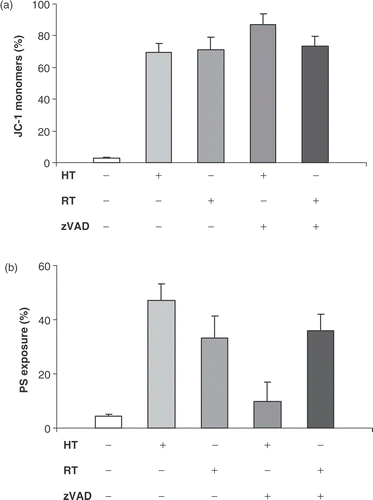
Figure 4. Effect of pan-caspase inhibitor zVAD-fmk on Δψm disruption and PS exposure. HL60 cells were treated with heat (HT; 43°C during 1 h) or γ-radiation (RT; 8 Gy) in the presence (+) or absence (−) of 20 µM zVAD-fmk. Figures show the percentage of cells, within the total population of 10 000 counted cells, showing fluorescence. (a) Percentage of cells with JC-1 monomers after 24 h, correlating with a depolarized mitochondrial membrane potential. (b) Percentage of cells that show PS exposure 48 h after induction of apoptosis. zVAD-fmk was added before induction of apoptosis and was continuously present. The results are the mean ± SD (n = 3).

Figure 5. Effect of caspase-2 inhibitor zVDVAD-fmk on Δψm disruption. HL60 cells were treated with heat (HT; 43°C during 1 h) or γ-radiation (RT; 8 Gy) in the presence or absence of 10 µM zVDVAD-fmk. Figures show the percentage of cells, within the total population of 10 000 counted cells, showing fluorescence. Percentage of cells with JC-1 monomers after 24 h, correlating with a depolarized mitochondrial membrane potential. The results are the mean ± SD (n = 3).
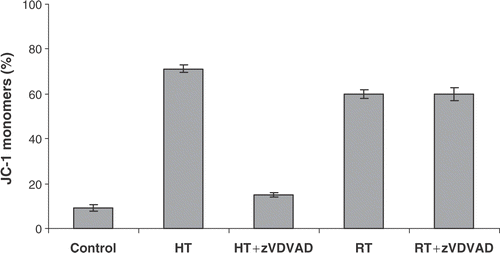
Figure 5. Effect of caspase-2 inhibitor zVDVAD-fmk on Δψm disruption. HL60 cells were treated with heat (HT; 43°C during 1 h) or γ-radiation (RT; 8 Gy) in the presence or absence of 10 µM zVDVAD-fmk. Figures show the percentage of cells, within the total population of 10 000 counted cells, showing fluorescence. Percentage of cells with JC-1 monomers after 24 h, correlating with a depolarized mitochondrial membrane potential. The results are the mean ± SD (n = 3).

Figure 6. Effects of heat-treatment (HT; 43°C during 1 h) and γ-radiation (RT; 8 Gy) on the morphology of HL60 cells in the presence or absence of 20 µM zVAD-fmk. The cells were fixed with methanol, stained with May-Grunwald-Giemsa and examined at 100 × magnification after 48 h. The images were taken with a light microscope (magnification × 100) and are representative of three independent experiments. Arrows indicate apoptotic cells and apoptotic bodies.
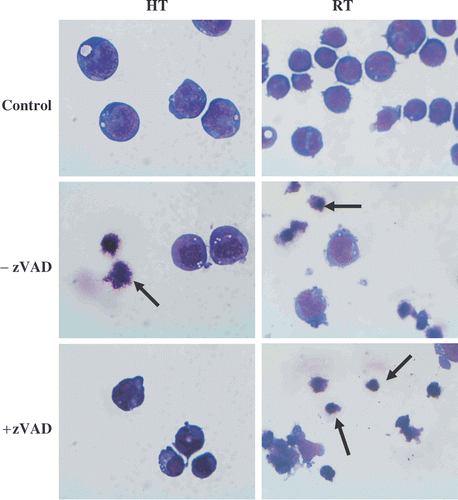
Figure 6. Effects of heat-treatment (HT; 43°C during 1 h) and γ-radiation (RT; 8 Gy) on the morphology of HL60 cells in the presence or absence of 20 µM zVAD-fmk. The cells were fixed with methanol, stained with May-Grunwald-Giemsa and examined at 100 × magnification after 48 h. The images were taken with a light microscope (magnification × 100) and are representative of three independent experiments. Arrows indicate apoptotic cells and apoptotic bodies.

Reprints and Corporate Permissions

Please note: Selecting permissions does not provide access to the full text of the article, please see our help page How do I view content?

To request a reprint or corporate permissions for this article, please click on the relevant link below:

Academic Permissions

Please note: Selecting permissions does not provide access to the full text of the article, please see our help page How do I view content?

Obtain permissions instantly via Rightslink by clicking on the button below:

If you are unable to obtain permissions via Rightslink, please complete and submit this Permissions form. For more information, please visit our Permissions help page.