461
Views
11
CrossRef citations to date
0
Altmetric
Original

Hyperthermia enhances tumour necrosis factor-related apoptosis-inducing ligand (TRAIL)-induced apoptosis in human cancer cells

, &
Pages 713-728 | Received 16 May 2006, Accepted 18 Oct 2006, Published online: 09 Jul 2009

Figures & data

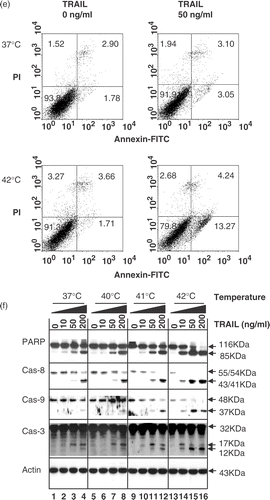
Figure 1. Effect of hyperthermia (40–42°C) on TRAIL-induced apoptosis in human colorectal carcinoma CX-1 cells. (a) Cells were treated with 200 ng ml−1 TRAIL for 4 h at 37°C or 42°C. The morphological features were analysed with a phase-contrast microscope. (b) Cells were treated with various concentrations of TRAIL (0–200 ng ml−1) for 4 h at various temperatures (37–42°C). Cell viability was determined by the trypan blue exclusion assay. Error bars represent standard error of the mean (SEM) from three separate experiments. Asterisks indicate values which are different from the respective control (t-test, p < o.05). (c) Cells were treated with 50 ng ml−1 TRAIL for 4 h at 37 or 42°C. Cell survival was determined by the colony formation assay. Error bars represent standard error of the mean (SEM) from three separate experiments. Asterisks indicate values which are different from the respective control (t-test, p < 0.05). (d) Cells were treated with TRAIL (200 ng ml−1) for 2 h at 37°C or 42°C. After treatment, apoptosis was detected by the TUNEL assay. (e) Cells were treated with TRAIL (50 ng ml−1) for 4 h at 37°C or 42°C. After treatment, apoptosis was detected by the flow cytometric assay. (f) Proteolytic cleavage of PARP and activation of caspases were assayed by Western blot analyses. Cells were treated for 4 h with various concentrations of TRAIL at various temperatures. Cell lysates were harvested and subjected to immunoblotting for caspase-8, caspase-9, caspase-3 or PARP. Antibody against caspase-8 detects inactive form (55/54 kDa) and cleaved intermediates (41, 43 kDa). Anti-caspase-9 antibody detects both inactive form (48 kDa) and cleaved intermediate (37 kDa). Anti-caspase-3 antibody detects inactive form (32 kDa) and cleaved active form (17 kDa). Immunoblots of PARP show the 116 kDa PARP and the 85 kDa apoptosis-related cleavage fragment. Actin was used to confirm the equal amount of proteins loaded in each lane.
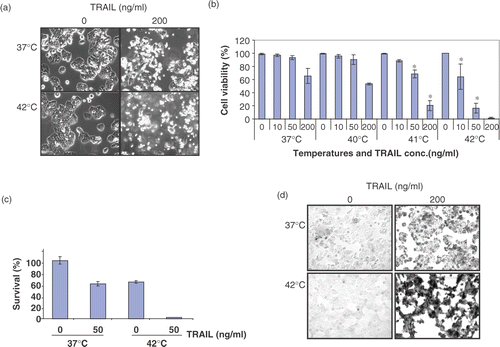
Figure 1. Effect of hyperthermia (40–42°C) on TRAIL-induced apoptosis in human colorectal carcinoma CX-1 cells. (a) Cells were treated with 200 ng ml−1 TRAIL for 4 h at 37°C or 42°C. The morphological features were analysed with a phase-contrast microscope. (b) Cells were treated with various concentrations of TRAIL (0–200 ng ml−1) for 4 h at various temperatures (37–42°C). Cell viability was determined by the trypan blue exclusion assay. Error bars represent standard error of the mean (SEM) from three separate experiments. Asterisks indicate values which are different from the respective control (t-test, p < o.05). (c) Cells were treated with 50 ng ml−1 TRAIL for 4 h at 37 or 42°C. Cell survival was determined by the colony formation assay. Error bars represent standard error of the mean (SEM) from three separate experiments. Asterisks indicate values which are different from the respective control (t-test, p < 0.05). (d) Cells were treated with TRAIL (200 ng ml−1) for 2 h at 37°C or 42°C. After treatment, apoptosis was detected by the TUNEL assay. (e) Cells were treated with TRAIL (50 ng ml−1) for 4 h at 37°C or 42°C. After treatment, apoptosis was detected by the flow cytometric assay. (f) Proteolytic cleavage of PARP and activation of caspases were assayed by Western blot analyses. Cells were treated for 4 h with various concentrations of TRAIL at various temperatures. Cell lysates were harvested and subjected to immunoblotting for caspase-8, caspase-9, caspase-3 or PARP. Antibody against caspase-8 detects inactive form (55/54 kDa) and cleaved intermediates (41, 43 kDa). Anti-caspase-9 antibody detects both inactive form (48 kDa) and cleaved intermediate (37 kDa). Anti-caspase-3 antibody detects inactive form (32 kDa) and cleaved active form (17 kDa). Immunoblots of PARP show the 116 kDa PARP and the 85 kDa apoptosis-related cleavage fragment. Actin was used to confirm the equal amount of proteins loaded in each lane.

Figure 2. Time course of apoptotic cell death during treatment with TRAIL in the conditions of normothermia and hyperthermia. (a) CX-1 cells were treated with 50 ng ml−1 TRAIL for various times (0.5–4 h) at 37°C or 42°C. The morphological features were analysed with a phase-contrast microscope. Con, untreated unheated control cells. (b) Cell viability was determined by the trypan blue exclusion assay. Error bars represent standard error of the mean (SEM) from three separate experiments. Asterisks indicate values which are different from the respective control (t-test, p < 0.05). (c) Time course of PARP cleavage and activation of caspases were assayed by Western blot analyses as described in .

Figure 2. Time course of apoptotic cell death during treatment with TRAIL in the conditions of normothermia and hyperthermia. (a) CX-1 cells were treated with 50 ng ml−1 TRAIL for various times (0.5–4 h) at 37°C or 42°C. The morphological features were analysed with a phase-contrast microscope. Con, untreated unheated control cells. (b) Cell viability was determined by the trypan blue exclusion assay. Error bars represent standard error of the mean (SEM) from three separate experiments. Asterisks indicate values which are different from the respective control (t-test, p < 0.05). (c) Time course of PARP cleavage and activation of caspases were assayed by Western blot analyses as described in Figure 1.

Figure 3. Effect of hyperthermia on TRAIL-induced apoptosis in other cell lines: MIA PaCa-2, BxPC-3 and DU-145 cells. (a) MIA PaCa-2 and BxPC-3 cells were heated at 40°C or 42°C for 4 h in the presence or absence of 50 ng ml−1 TRAIL. Cell survival was determined by the trypan blue exclusion assay. Error bars represent standard error of the mean (SEM) from three separate experiments. Asterisks indicate values which are different from the respective control (t-test, p < 0.05). (b, c) Cell lysates were subjected to immunoblotting for PARP and caspases as described in .

Figure 3. Effect of hyperthermia on TRAIL-induced apoptosis in other cell lines: MIA PaCa-2, BxPC-3 and DU-145 cells. (a) MIA PaCa-2 and BxPC-3 cells were heated at 40°C or 42°C for 4 h in the presence or absence of 50 ng ml−1 TRAIL. Cell survival was determined by the trypan blue exclusion assay. Error bars represent standard error of the mean (SEM) from three separate experiments. Asterisks indicate values which are different from the respective control (t-test, p < 0.05). (b, c) Cell lysates were subjected to immunoblotting for PARP and caspases as described in Figure 1.

Figure 4. Effect of hyperthermia in combination with TRAIL on cell morphology, proteolytic cleavage of PARP and activation of caspases in normal cell lines CCD-33Co and YPEN-1. (a) CCD-33Co cells were heated at 42°C for 4 h in the presence or absence of 50 ng ml−1 TRAIL. The morphological features were analysed with a phase-contrast microscope. (b, c) CCD-33Co cells or YPEN-1 cells were heated at 42°C for 4 h in the presence or absence of 50 ng ml−1 TRAIL. Cell lysates were subjected to immunoblotting for PARP and caspases as described in .
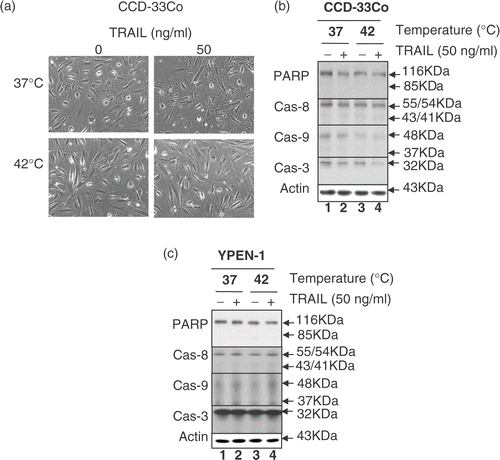
Figure 4. Effect of hyperthermia in combination with TRAIL on cell morphology, proteolytic cleavage of PARP and activation of caspases in normal cell lines CCD-33Co and YPEN-1. (a) CCD-33Co cells were heated at 42°C for 4 h in the presence or absence of 50 ng ml−1 TRAIL. The morphological features were analysed with a phase-contrast microscope. (b, c) CCD-33Co cells or YPEN-1 cells were heated at 42°C for 4 h in the presence or absence of 50 ng ml−1 TRAIL. Cell lysates were subjected to immunoblotting for PARP and caspases as described in Figure 1.

Figure 5. Intra-cellular levels of TRAIL receptors during treatment with TRAIL in the conditions of normothermia and hyperthermia. CX-1 cells were treated for 4 h with various concentrations of TRAIL (0–200 ng ml−1) in the indicated temperatures. To measure the levels of death receptors and decoy receptors during treatment with TRAIL in normothermia and hyperthermia, equal amounts of protein (20 µg) were separated by sodium dodecyl sulphate–polyacrylamide gel electrophoresis (SDS–PAGE) and immunoblotted as described in Materials and methods. Actin was shown as an internal standard.

Figure 5. Intra-cellular levels of TRAIL receptors during treatment with TRAIL in the conditions of normothermia and hyperthermia. CX-1 cells were treated for 4 h with various concentrations of TRAIL (0–200 ng ml−1) in the indicated temperatures. To measure the levels of death receptors and decoy receptors during treatment with TRAIL in normothermia and hyperthermia, equal amounts of protein (20 µg) were separated by sodium dodecyl sulphate–polyacrylamide gel electrophoresis (SDS–PAGE) and immunoblotted as described in Materials and methods. Actin was shown as an internal standard.

Figure 6. Intra-cellular levels of anti-apoptotic proteins during treatment with TRAIL in the conditions of normothermia and hyperthermia. CX-1 cells were treated for 4 h with various concentrations of TRAIL (0–200 ng ml−1) in the indicated temperatures. To determine the intra-cellular levels of anti-apoptotic proteins during treatment with TRAIL in normothermia and hyperthermia, equal amounts of protein (20 µg) were separated and immunoblotted as described in Materials and methods. Actin was shown as an internal standard.
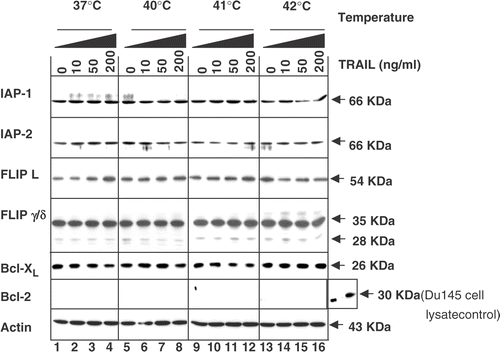
Figure 6. Intra-cellular levels of anti-apoptotic proteins during treatment with TRAIL in the conditions of normothermia and hyperthermia. CX-1 cells were treated for 4 h with various concentrations of TRAIL (0–200 ng ml−1) in the indicated temperatures. To determine the intra-cellular levels of anti-apoptotic proteins during treatment with TRAIL in normothermia and hyperthermia, equal amounts of protein (20 µg) were separated and immunoblotted as described in Materials and methods. Actin was shown as an internal standard.

Figure 7. Effects of hyperthermia on caspase activity. CX-1 cells were treated with or without 200 ng ml−1 of TRAIL for 2 h and the cell lysates were prepared for caspase activity. Cell lysates was subjected to reaction at 37°C or 42°C for 2 h. U, untreated cell lysates. T, TRAIL treated cell lysates. Error bars represent standard error of the mean (SEM) from three separate experiments. Asterisks indicate values which are different from the respective control (t-test, p < 0.05).
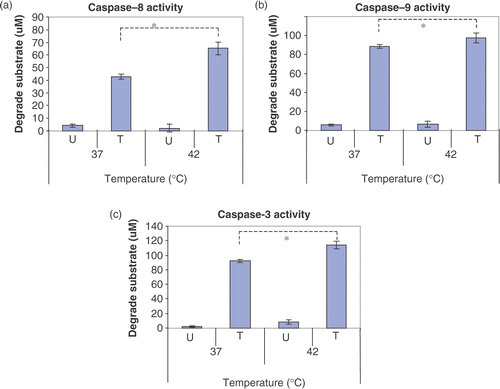
Figure 7. Effects of hyperthermia on caspase activity. CX-1 cells were treated with or without 200 ng ml−1 of TRAIL for 2 h and the cell lysates were prepared for caspase activity. Cell lysates was subjected to reaction at 37°C or 42°C for 2 h. U, untreated cell lysates. T, TRAIL treated cell lysates. Error bars represent standard error of the mean (SEM) from three separate experiments. Asterisks indicate values which are different from the respective control (t-test, p < 0.05).
Reprints and Corporate Permissions

Please note: Selecting permissions does not provide access to the full text of the article, please see our help page How do I view content?

To request a reprint or corporate permissions for this article, please click on the relevant link below:

Academic Permissions

Please note: Selecting permissions does not provide access to the full text of the article, please see our help page How do I view content?

Obtain permissions instantly via Rightslink by clicking on the button below:

If you are unable to obtain permissions via Rightslink, please complete and submit this Permissions form. For more information, please visit our Permissions help page.