Figures & data
Figure 1. Model of the phantom used for this calculation study in sagittal and transverse direction. The central point (0, 0, 0) is marked as little orange spot and the axes in the sagittal picture show the distances in cm. The x-axis goes right–left, with positive values on left (L). The y-axis is anterior–posterior with positive values posterior (P) and the z-axis goes caudal-cranial with positive values cranial or head (H), building a L-P-H system. The presacral tumor is shown in red, located posterior from the centre of the model with its centre of gravity about 2 cm posterior to the centre of the model. Calculated fatty tissue is a small equidistant border around the elliptic phantom material. Phantom material is calculated as muscle tissue.
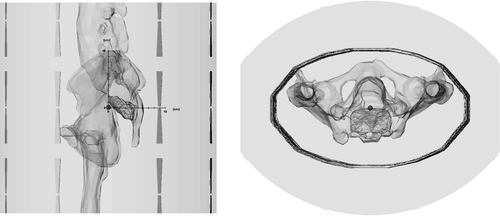
Table I. Physical and physiological properties used for the calculations in Amira-HyperPlan [see also Citation[14].
Table II. Definition of the calculated thermal parameters T90, T50, hot spot volume, total power, sensitivity.
Table III. Mean, median and standard deviation in cm of the applicator-shifting in x-(lateral), y-(posterior) and z-(longitudinal) direction during the 112 treatment sessions of the first 10 male and 10 female patients (without positioning device) together with the numbers of treatments per patient.
Table IV. Mean values and standard deviation of T90, T50, sensitivity and hot spot volume for all different adjustments used in this study. It is clearly shown, that the plans with amplitude and phase optimisation (A plan) result in the highest temperatures, but also in the highest sensitivity to small changes of the amplifier control parameters phase and amplitude. Permitted total power is highest for the optimisation strategy with the largest number of degrees of freedom (A plans), whereas the hot spot volume decreases by optimisation. The lowest total power and the highest hot spot volumes are reached with standard steering, which have the lowest index temperatures and also the lowest sensitivity.
Figure 2. Dependency of 430 calculated T90 values on the x- (lateral) positions by optimising according A plans (with amplitude and phase optimisation, squares), B plans (only phase optimisation, triangles) and the standard setup (circles). Points show the value for y = 0 and z = 0, with bars the range of minimal and maximal T90 values (for y ≠ 0 and z ≠ 0) is shown. The central x-values (x = 0) result in the best T90 values after optimisation. The standard adjustments show a higher difference between the best central and the lateral positions than the optimised adjustments. The highest values are reached by A plans, which have the largest number of degrees of freedom.
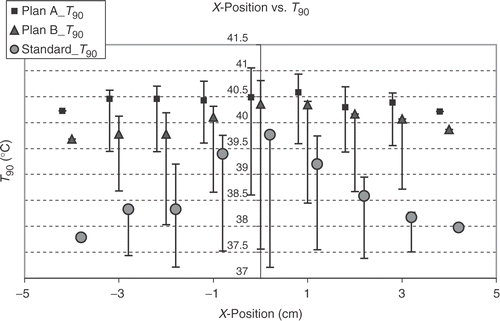
Figure 3. Dependency of 430 calculated T90 values on the y-(anterior-posterior) positions by optimising according A plans (with amplitude and phase optimisation, squares), B plans (only phase optimisation, triangles) and the standard setup (circles). Points show the values for x = 0 and z = 0, with bars the range for x ≠ 0 and z ≠ 0 is shown. The optimised adjustments show a clear dependency on the y-position with the optimum around the centre. The standard adjustments show a similar dependency on the y-position. For the same number of different positions at a particular y-position the range of T90 is smallest for A plans and greatest for standard steering. At the centre of gravity of the tumour at position y = 2 and also the next more posterior located position (y = 3), A plans show the best T90. The lowest T90 for each adjustment are at position y = −5.
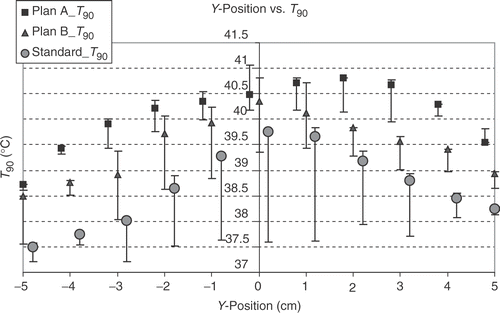
Figure 4. Dependency of 430 calculated T90 values on the z-(longitudinal) positions by optimising according A plans (with amplitude and phase optimisation, squares), B plans (only phase optimisation, triangles) and the standard setup (circles). Points stand for x = 0 and y = 0, with bars the range for x ≠ 0 and y ≠ 0 is shown. (For z = 6 and z < −5 there is only one position calculated.) The optimised adjustments indicate two suitable positions to increase T90: at z = 0 (especially B plans and standard adjustments) and even better for z = 8 cm (in cranial direction). For the standard adjustments the range around z = 0 shows nearly a plateau from −3 to 2 cm. At z > 6 there is no improvement of the T90 values for standard adjustment. For A plans and z = 0 only positions with y ≠ 0 yield better T90 than the adjacent z positions, but for z = 8 there is a clear improvement of T90.
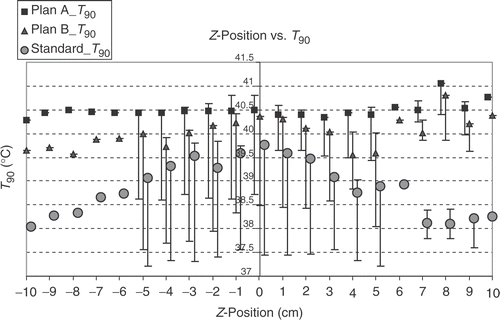
Table V. Correlation among the thermal parameters T90 and T50, total power, sensitivity (to adjustment changes), hot spot volume, differences δ of T90 and total power (optimised minus standard adjustment) and power needed to raise T90 by 1°C (power per °C T90). The correlation and significance was calculated with Spearman-Rho with the software SPSS 12.0. There exists a close linear correlation between the index temperatures T90 and T50. Total power has a good linear correlation with T90 only for B plans and standard steering but not for A plans. Hot spot volume correlates with total power just for standard steering. A linear correlation exists for δ total power vs power per °C T90, for A plans more than for B plans. There is only a weak linear correlation between δ T90 vs. δ total power and a negative correlation between T90 and the power per °C T90. There is no close linear correlation between sensitivity and T90, total power or hot spot volume.
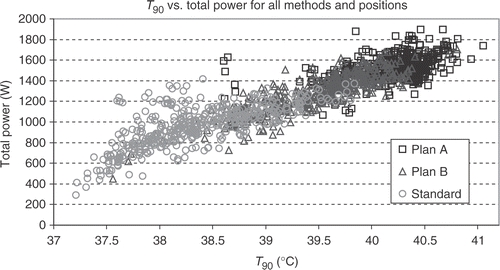
Figure 5. Scatterogram of T90 vs. total power. For high T90's a high total power is necessary, no matter which kind of phase control is used (there are only very few exceptions, where the power is high but T90 is relatively low). Optimised phase and amplitude control reduces hot spots, so that the total power can be elevated and T90 increases. The lowest T90 for all adjustments is at position x = 0, y = −5 and z = −5 with the centre of the applicator just behind the mid-pubic symphysis. The power at this position is low for standard steering and B plans but quite high for A plans, adding only about 1.4°C to T90 with about 1300 W additional power in comparison to standard steering and 1.05°C with about 1200 W additional power in comparison to B plan steering. One problem is permanent: only 150 W per antenna is available from the amplifier, so these calculated power levels for A plans can not be used. Amplitude optimisation is done by amplitude reduction of several antennas, and maximum power with all 12 antennas (with full power) is restricted to 1800 W.