Figures & data
Figure 1. In vitro and in vivo anti-tumour effect in the thermotherapy only (HT) group. Correlation coefficient R = 0.91 (p = 0.089).
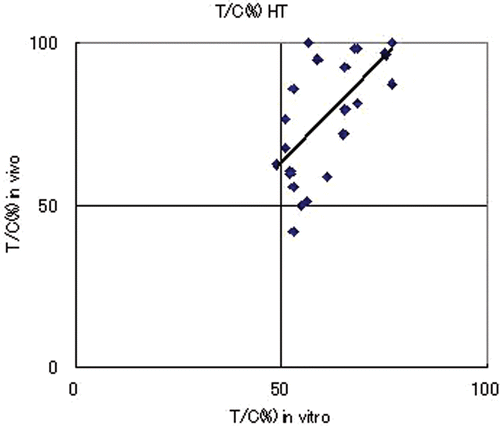
Figure 2. Comparison of in vivo anti-tumour effect of thermotherapy alone (HT) and thermotherapy plus chemotherapy (HT + CT).
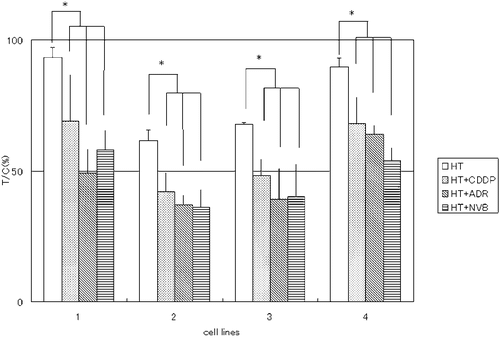
Figure 3. Comparison of in vivo anti-tumour effect of CDDP, ADR and NVB in the CT and HT + CT groups. (a) CDDP, (b) ADR, (c) NVB.
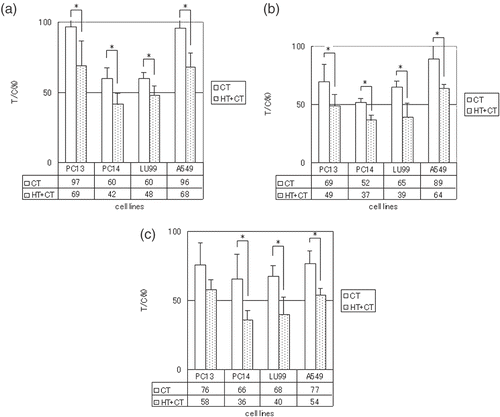
Figure 4. Correlation between in vitro and in vivo anti-tumour effects in (a) CT group and (b) HT + CT group. Correlation coefficient (a) R = 0.76 (p = 0.089), (b) R = 0.65 (p = 0.021).
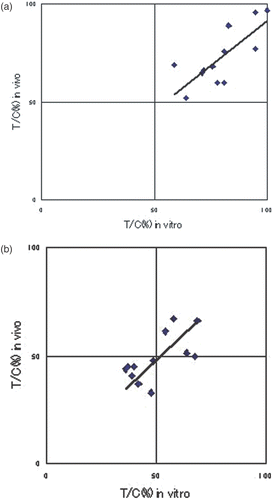
Figure 5. Correlation between in vitro and in vivo anti-tumour effects of HT + CT with (a) CDDP, (b) ADR, and (c) NVB, respectively. Correlation coefficient (a) R = 0.87 (p = 0.13), (b) R = 0.88 (p = 0.12), (c) R = 0.99 (p = 0.009).
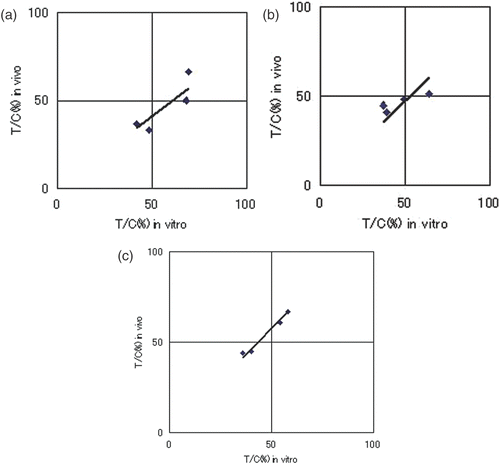
Table I. Accuracy, sensitivity and specificity in vivo and in vitro of HT + CT group.