Figures & data
Figure 1. Left: picture of the Lucite cone applicator indicating its principal E-field direction (arrow); and right: symbolic representation of the LCA footprint.
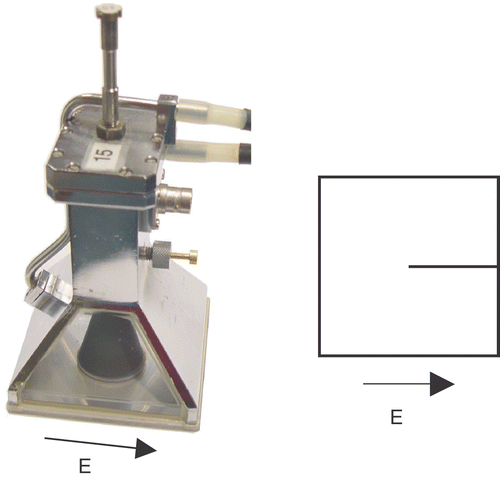
Table I. Properties of the tissues and applicator materials applied in the models.
Figure 2. (a) Melanoma lesions. (b–c) Model implementation: LCA applicator and (b) simplified anatomy, or (c) segmented anatomy (water bolus not shown).
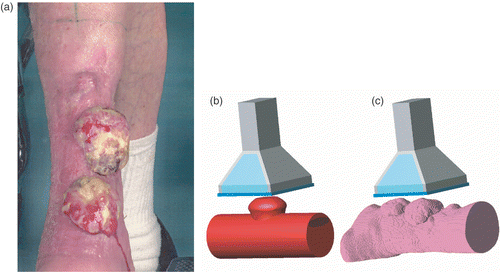
Figure 3. Results for the simplified anatomy: absorbed power in a transverse cross-section through the tumour, for three different applicators (LCA, LA, CWA) and two orientations of the electric field (parallel (//) or perpendicular (⊥) to the lower leg).
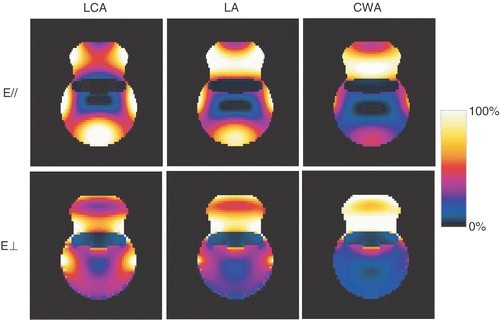
Figure 4. Results for the segmented anatomy: absorbed power in a transverse cross-section through the tumour, for three different applicators (LCA, LA, CWA) and two orientations of the electric field (parallel (//) or perpendicular (⊥) to the lower leg).
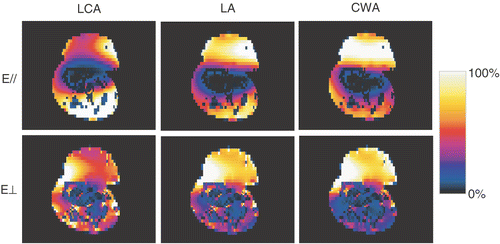
Figure 5. Mean tumour temperatures during the hyperthermia treatments. After the first treatment, the applicator set-up was changed based on treatment planning.
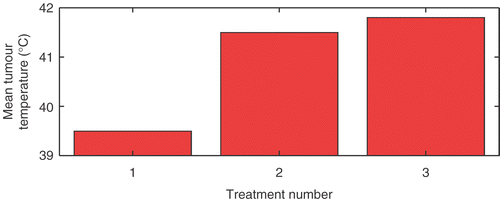
Figure 6. (a) X-thorax of the patient in case 2. The cerclage wires are numbered 1–7. The deeper-seated heart valves are also visible. (b) Overview of the abstract model: LCA with a water bolus placed above an elliptic bone with a metallic ring (muscle volume not shown).
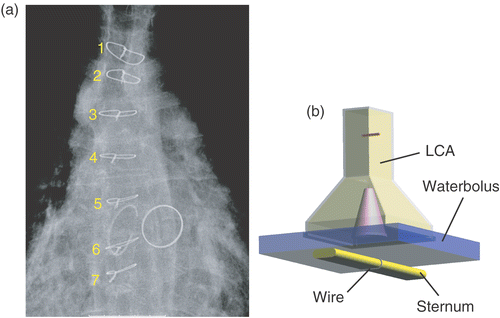
Figure 7. SAR cross-sections for a sternum without (left) and with a sternum cerclage wire (right), for E-field directions parallel (top, E//), and perpendicular (bottom, E⊥) to the sternum.
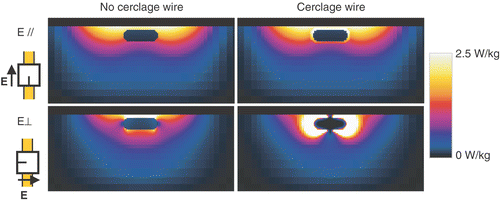
Figure 8. Transverse CT slice through the centre of the tumour. The tumour outline is indicated with a contour. The arrows show the tumour depth (3.7–5.4 cm), and the thickness of the fat layer (2.9 cm).
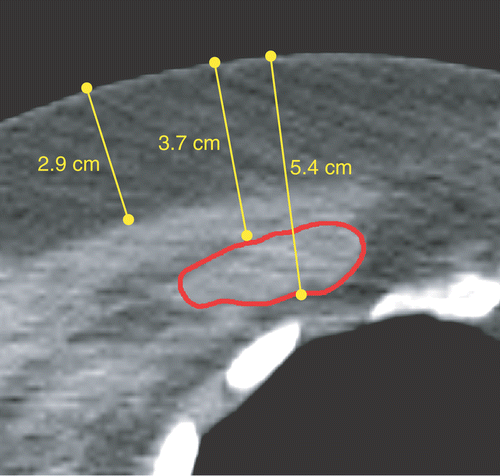
Figure 9. (a) Position of the LCA centrally above the tumour. Here, the E-field direction is perpendicular to the body axis. (b) Normalized SAR profile centrally below the applicator (E-field direction perpendicular), showing the main SAR peak at the muscle and tumour.
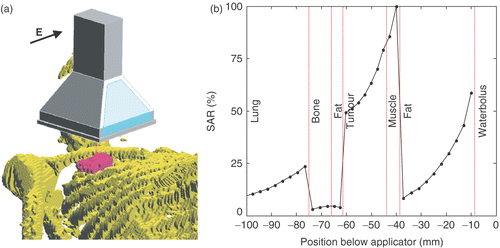
Figure 10. SAR coverage for E-field directions parallel (top) and perpendicular (bottom) to the body axis. The 75%, 50%, and 25% iso-SAR surfaces are depicted. The insets show the inferior view of the tumour's SAR coverage.
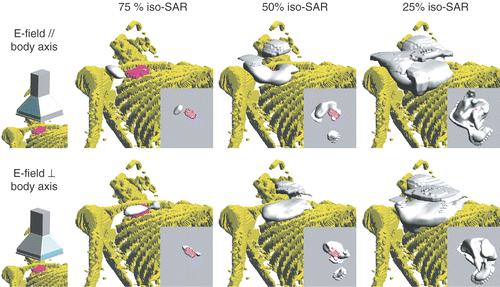
Table II. Mean (range) steady-state temperatures measured in the tumour of case 3.
Figure 11. Local supraclavicular schwannoma recurrence.
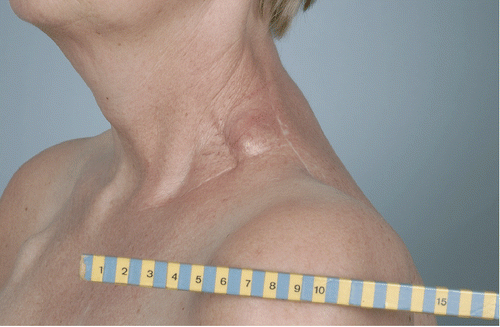
Figure 12. Overview of the model configuration: the LCA targeted at the posterior triangle of the neck of the SAM phantom (water bolus not shown). The lines show the projection of the centre and extent of the applicator horn on the anatomy.
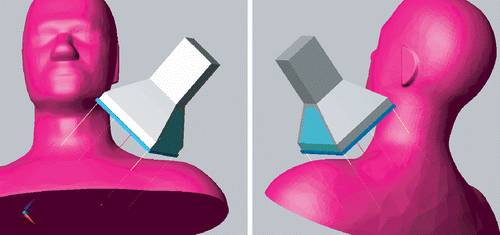
Figure 13. Normalized SAR in the SAM phantom, centrally below the applicator. SAR cross-sections for two orientations of the LCA are shown: in the top row the Lucite windows (L), and in bottom row the metal edges (M) face the shoulder and the neck.
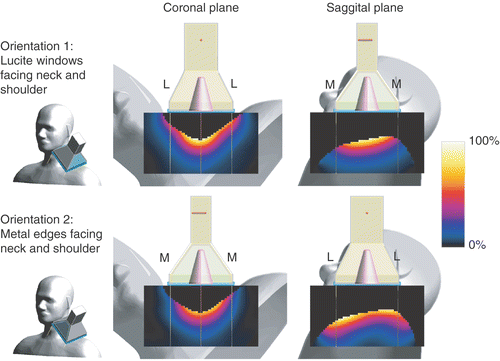
Figure 14. (a) Transverse CT-slice of the thorax showing the exophytic Merkel cell carcinoma. The white line at the base of the tumour is one of the thermometry catheters. (b) Overview of the 2-by-2 umbrella-style LCA array placed onto the anatomy.
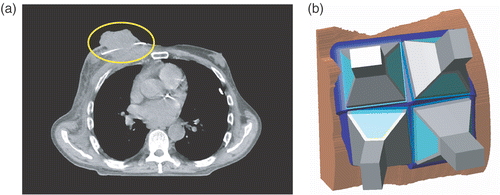
Figure 15. Individual SAR contribution of the applicators. Relative scaling: (a) [5 0 0 0], (b) [0 5 0 0], (c) [0 0 5 0] and (d) [0 0 0 5]. Isosurface at 10 W/kg. The applicators are represented schematically by their square aperture of 10 × 10 cm2.
![Figure 15. Individual SAR contribution of the applicators. Relative scaling: (a) [5 0 0 0], (b) [0 5 0 0], (c) [0 0 5 0] and (d) [0 0 0 5]. Isosurface at 10 W/kg. The applicators are represented schematically by their square aperture of 10 × 10 cm2.](/cms/asset/6ae4727b-43f9-4188-b332-1a61842417ff/ihyt_a_250077_f0015_b.gif)
Figure 16. The 5-W/kg SAR isosurface resulting from scaling factors [4.25, 3, 3.5, 4.25]. The hole in the isosurface at the tumour centre is clearly visible.
![Figure 16. The 5-W/kg SAR isosurface resulting from scaling factors [4.25, 3, 3.5, 4.25]. The hole in the isosurface at the tumour centre is clearly visible.](/cms/asset/a30e4af3-640c-456f-8448-af2660c81f83/ihyt_a_250077_f0016_b.gif)