Figures & data
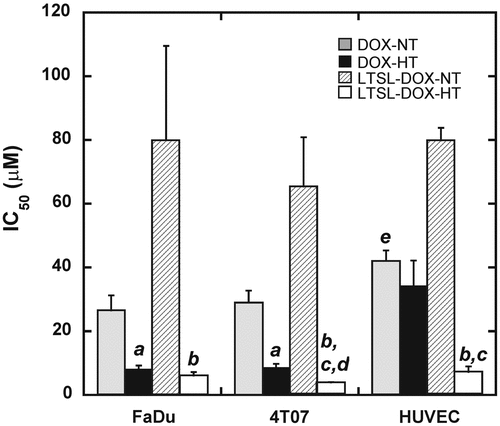
Figure 1. Average RBC velocities in 4T07 tumors treated with LTSL-DOX-HT (n = 7) and LTSL-HT (n = 5). The velocity was measured at 0.5 h before, at 0, 6 and 24 h after the treatment. Error bars, SEM; *, p < 0.05, when comparing data between LTSL-DOX-HT and LTSL-HT groups. In addition, the velocities at 0, 6, and 24 h were significantly less than that before the treatment in the LTSL-DOX-HT group (p < 0.05), whereas the decrease in RBC velocity after the treatment was statistically significant (i.e. p < 0.05) only at 24 h in the LTSL-HT group.
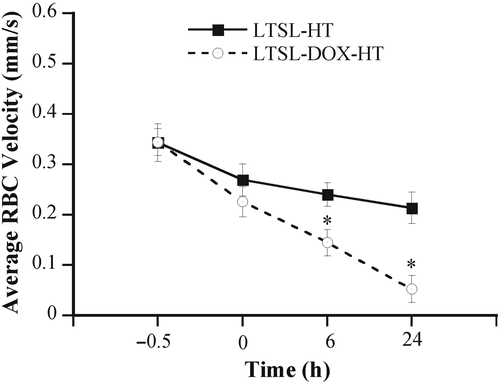
Figure 2. Tumor microvascular permeability in FaDu and 4T07 tumors treated with (HT) or without hyperthermia (NT) (n = 7 in each group), PAF alone or PAF plus HT (n = 5 in each group). Error bars, SEM; (a) p < 0.05, FaDu NT versus 4T07 NT; (b) p < 0.01, FaDu HT versus FaDu NT and 4T07 HT; (c) p < 0.01, 4T07 PAF versus 4T07 NT; (d) p < 0.05, 4T07 PAF versus FaDu NT; (e) p < 0.01, 4T07 HT+PAF versus 4T07 NT, 4T07 HT or FaDu NT.
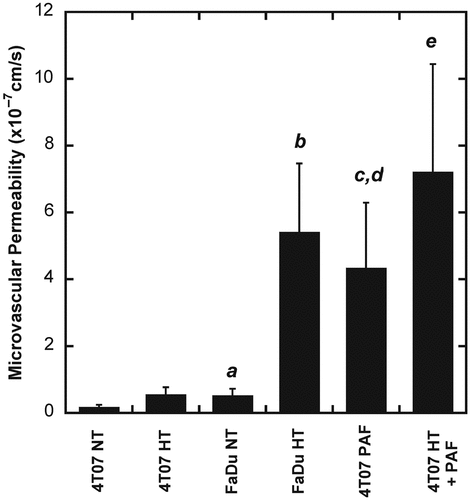
Figure 3. Typical images of tumor surfaces in (A) control and (B) LTSL-DOX-HT treated groups. In each group, the images show the network of tumor vasculature at (a) 0.5 h before treatment, and at (b) 0 h, (c) 6 h, (d) 24 h, and (e) 72 h after treatment.
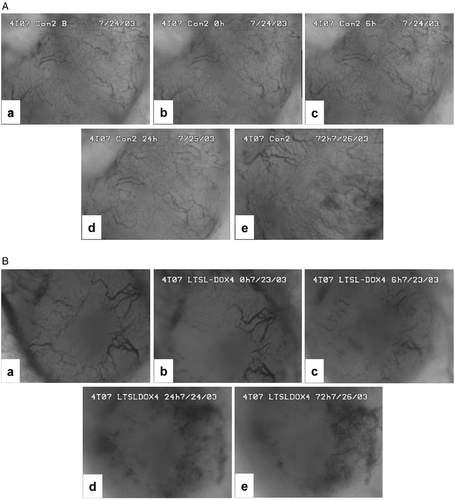
Figure 4. Microvascular density in 4T07 tumors treated with LTSL-DOX-HT (n = 7), LTSL-HT (n = 5), and PAF-LTSL-DOX-HT (n = 5). Error bars, SEM; *p < 0.05, when comparing data between PAF-LTSL-DOX-HT and LTSL-HT or LTSL-DOX-HT groups at 0 and 6 h. In addition, the difference in data at 24 h between LTSL-HT and LTSL-DOX-HT or PAF-LTSL-DOX-HT groups was statistically significant (p < 0.05).
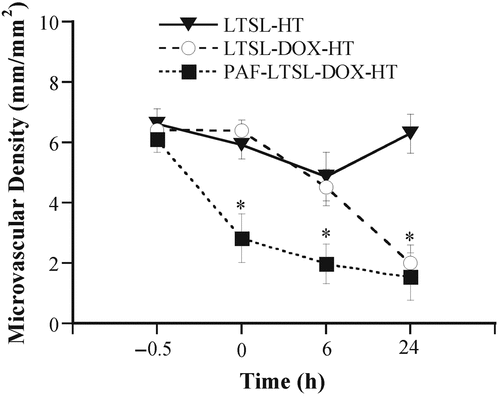
Figure 5. Cytotoxicity of DOX and LTSL-DOX to tumor cells and HUVEC. FaDu and 4T07 cells as well as HUVEC were treated with DOX or LTSL-DOX at a range of exponentially increasing DOX concentrations or equivalent DOX concentrations between 0.001 μM and 100 μM at 37°C (NT) or 42°C (HT) for 1 h. Then, the cells were incubated in fresh medium for 24 h, followed by the cytotoxicity assay. The percentage of viable cells was calculated relative to untreated cells. All assays were performed in triplicate. IC50 values were calculated from the dose–response curves by curve fitting the data. Error bars, SEM; (a) p < 0.01, DOX-HT versus DOX-NT; (b) p < 0.05, LTSL-DOX-HT versus LTSL-DOX-NT; (c), p < 0.05, LTSL-DOX-HT versus DOX-HT; (d) p < 0.05, LTSL-DOX-HT from 4T07 group versus LTSL-DOX-HT from FaDu group; (e) p < 0.05, DOX-NT versus LTSL-DOX-NT.