336
Views
6
CrossRef citations to date
0
Altmetric
Original

Bax-mediated mitochondrial membrane permeabilization after heat treatment is caspase-2 dependent

, , , &
Pages 357-365 | Received 05 Jul 2007, Accepted 26 Jan 2008, Published online: 09 Jul 2009

Figures & data

Figure 1. Intracellular Bcl-2 and Bax protein levels. (a) Percentage increase in Bax MFR 2 h after treatment compared to Bax MFR of untreated cells. (b) Percentage decrease in Bcl-2 MFR 2 h after treatment compared to untreated cells. The experiments were performed on three cell lines HL60, HSB2 and Kasumi-1. The treatments given were heat treatment (HT), irradiation (RT), heat treatment directly followed by irradiation (HT+RT) and irradiation directly followed by heat treatment (RT+HT) (See also Materials and methods, Apoptosis inducing treatments). The MFR, defined as the ratio of the mean fluorescent intensity (MFI) of primary antibody and the MFI of the isotype control stained cells, was used as a measure for Bcl-2 or Bax protein expression. The results are the mean ± SEM of three independent experiments. †Indicates a p < 0.01 between the groups RT and HT, RT and HT+RT, RT and RT+HT as determined by 1-way ANOVA. *p < 0.05, **p < 0.01 relative to control cells as determined by Student's t-test.
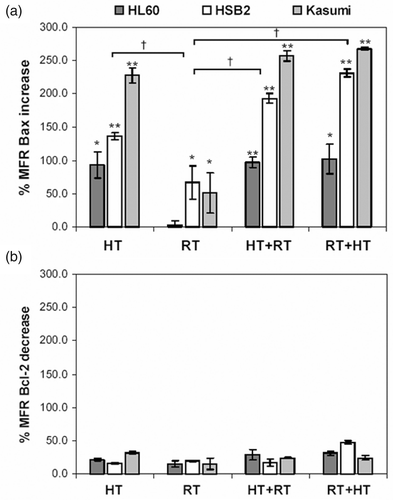
Figure 1. Intracellular Bcl-2 and Bax protein levels. (a) Percentage increase in Bax MFR 2 h after treatment compared to Bax MFR of untreated cells. (b) Percentage decrease in Bcl-2 MFR 2 h after treatment compared to untreated cells. The experiments were performed on three cell lines HL60, HSB2 and Kasumi-1. The treatments given were heat treatment (HT), irradiation (RT), heat treatment directly followed by irradiation (HT+RT) and irradiation directly followed by heat treatment (RT+HT) (See also Materials and methods, Apoptosis inducing treatments). The MFR, defined as the ratio of the mean fluorescent intensity (MFI) of primary antibody and the MFI of the isotype control stained cells, was used as a measure for Bcl-2 or Bax protein expression. The results are the mean ± SEM of three independent experiments. †Indicates a p < 0.01 between the groups RT and HT, RT and HT+RT, RT and RT+HT as determined by 1-way ANOVA. *p < 0.05, **p < 0.01 relative to control cells as determined by Student's t-test.

Figure 2. Localization and expression of Bcl-2 and Bax. Images of Bcl-2 (green fluorescent) and Bax (red fluorescent) proteins in HL60, HSB2 and Kasumi-1 cells. Samples were taken of untreated control cells and 2 h after heat treatment (HT) or irradiation (RT). The cells were fixed and stained as described in Materials and methods. Each confocal microscope image (a-i) is built up by 4 pictures namely Bcl-2 alone, bright field, Bax alone and overlay of Bcl-2 and Bax (from left to right, top to bottom). Bax and Bcl-2 fluorescence intensities were quantified using ImageJ software corrected for the surface area and compared to the fluorescence intensities of control cells, see results. Images are representative of three independent experiments.
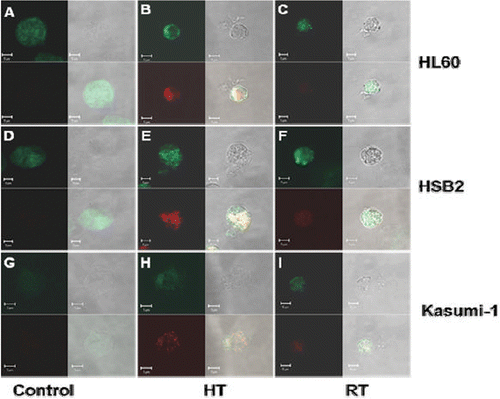
Figure 2. Localization and expression of Bcl-2 and Bax. Images of Bcl-2 (green fluorescent) and Bax (red fluorescent) proteins in HL60, HSB2 and Kasumi-1 cells. Samples were taken of untreated control cells and 2 h after heat treatment (HT) or irradiation (RT). The cells were fixed and stained as described in Materials and methods. Each confocal microscope image (a-i) is built up by 4 pictures namely Bcl-2 alone, bright field, Bax alone and overlay of Bcl-2 and Bax (from left to right, top to bottom). Bax and Bcl-2 fluorescence intensities were quantified using ImageJ software corrected for the surface area and compared to the fluorescence intensities of control cells, see results. Images are representative of three independent experiments.

Figure 3. Cytochrome c release into the cytosol. Percentage of cytochrome c release 6 h after heat treatment (HT) or irradiation (RT) compared to untreated cells (For details see Materials and methods, Apoptosis inducing treatments). The results are the mean ± SEM of three independent experiments. †Indicates a p < 0.05 between the groups HT, RT and control cells as determined by 1-way ANOVA. *p < 0.05, **p < 0.01 relative to control cells as determined by Student's t-test.
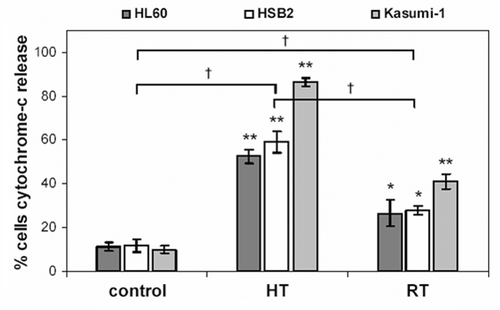
Figure 3. Cytochrome c release into the cytosol. Percentage of cytochrome c release 6 h after heat treatment (HT) or irradiation (RT) compared to untreated cells (For details see Materials and methods, Apoptosis inducing treatments). The results are the mean ± SEM of three independent experiments. †Indicates a p < 0.05 between the groups HT, RT and control cells as determined by 1-way ANOVA. *p < 0.05, **p < 0.01 relative to control cells as determined by Student's t-test.

Figure 4. Effect of caspase-2 inhibitor on Bax expression and cytochrome c release. (a) Percentage increase in Bax MFR 2 h after treatment compared to Bax MFR of untreated cells. The treatments given were heat treatment (HT) and irradiation (RT) (for details see Materials and methods, Apoptosis inducing treatments). The HL60, HSB2 and Kasumi-1 cells were incubated with (+) or without (−) 10 μM zVDVAD-fmk for 1 h before treatment. The results are the mean ± SEM of three independent experiments. * indicates a significant difference in relative increase in Bax expression compared to heat-treated cells without zVDVAD-fmk (p < 0.05, as determined by Student's t-test). (b) Percentage of cells with cytochrome c release 6 h after heat treatment (HT) or irradiation (RT) compared to untreated cells. The HL60, HSB2 and Kasumi-1 cells were incubated with (+) or without (−)10 μM zVDVAD-fmk for 1 h before treatment. The results are the mean ± SEM of three independent experiments. **Indicates a significant difference in cytochrome c release compared to heat treated cells without the presence of zVDVAD-fmk (p < 0.05, as determined by Student's t-test).
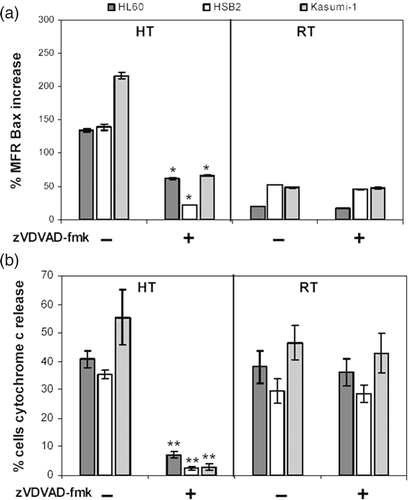
Figure 4. Effect of caspase-2 inhibitor on Bax expression and cytochrome c release. (a) Percentage increase in Bax MFR 2 h after treatment compared to Bax MFR of untreated cells. The treatments given were heat treatment (HT) and irradiation (RT) (for details see Materials and methods, Apoptosis inducing treatments). The HL60, HSB2 and Kasumi-1 cells were incubated with (+) or without (−) 10 μM zVDVAD-fmk for 1 h before treatment. The results are the mean ± SEM of three independent experiments. * indicates a significant difference in relative increase in Bax expression compared to heat-treated cells without zVDVAD-fmk (p < 0.05, as determined by Student's t-test). (b) Percentage of cells with cytochrome c release 6 h after heat treatment (HT) or irradiation (RT) compared to untreated cells. The HL60, HSB2 and Kasumi-1 cells were incubated with (+) or without (−)10 μM zVDVAD-fmk for 1 h before treatment. The results are the mean ± SEM of three independent experiments. **Indicates a significant difference in cytochrome c release compared to heat treated cells without the presence of zVDVAD-fmk (p < 0.05, as determined by Student's t-test).

Reprints and Corporate Permissions

Please note: Selecting permissions does not provide access to the full text of the article, please see our help page How do I view content?

To request a reprint or corporate permissions for this article, please click on the relevant link below:

Academic Permissions

Please note: Selecting permissions does not provide access to the full text of the article, please see our help page How do I view content?

Obtain permissions instantly via Rightslink by clicking on the button below:

If you are unable to obtain permissions via Rightslink, please complete and submit this Permissions form. For more information, please visit our Permissions help page.