505
Views
15
CrossRef citations to date
0
Altmetric
Original

Global gene expression analyses reveal changes in biological processes after hyperthermia in a rat glioma model

, , &
Pages 425-441 | Received 27 Jun 2007, Accepted 25 Mar 2008, Published online: 09 Jul 2009

Figures & data

Figure 1. Outline of sample collection. We analyzed global gene expression at 0, 45, 90 and 180 min in the four treatment groups in vivo, at 0, 180 and 300 min in the in vitro control group (3 samples), and at 0, 60, 180 and 300 minutes in the in vitro HT group (4 samples). *, equal amounts of total RNA from four parallel samples were mixed and analyzed as one by the microarrays; bar, indicate HT treatment session; arrow, CTX or saline injected at start of HT; MA, microarray.
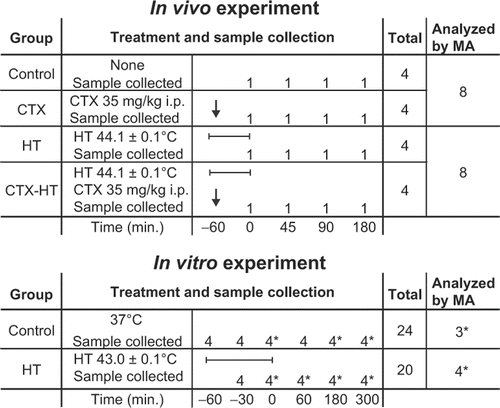
Figure 1. Outline of sample collection. We analyzed global gene expression at 0, 45, 90 and 180 min in the four treatment groups in vivo, at 0, 180 and 300 min in the in vitro control group (3 samples), and at 0, 60, 180 and 300 minutes in the in vitro HT group (4 samples). *, equal amounts of total RNA from four parallel samples were mixed and analyzed as one by the microarrays; bar, indicate HT treatment session; arrow, CTX or saline injected at start of HT; MA, microarray.

Table I.  RT-PCR primer sequences

Figure 2. Supervised screen for HSP and genes involved in the immune system in the dataset of 1213 genes found differentially expressed after HT by SAM analysis in vivo. (A) HSPs differentially expressed in vivo and (B) the corresponding HSP genes in vitro. (C) genes involved in the immune system, especially HSP, T-cell, NK cell and APC related genes. Only a few genes involved in this immune system cluster were also differentially expressed in vitro (data not shown).Genes analyzed and displayed as single channel data, p-values, Student's t-test. (D) and (E) Immunohistochemical staining of CD8 positive cells (cytotoxic T-lymphocytes and NK cells) (D) and MHC class II Ia positive cells (B-lymphocytes, dendritic cells and macrophages) (E), pictures display representative staining from the periphery of a tumor treated with hyperthermia, percentage of positive cells displayed in the graphs. Pictures taken at x400 resolution, 25 µm scale bar. The figures have been proportionally adjusted in size after composition. No other adjustments of pictures.
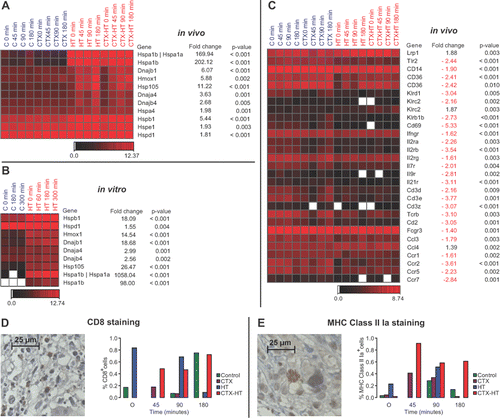
Figure 2. Supervised screen for HSP and genes involved in the immune system in the dataset of 1213 genes found differentially expressed after HT by SAM analysis in vivo. (A) HSPs differentially expressed in vivo and (B) the corresponding HSP genes in vitro. (C) genes involved in the immune system, especially HSP, T-cell, NK cell and APC related genes. Only a few genes involved in this immune system cluster were also differentially expressed in vitro (data not shown).Genes analyzed and displayed as single channel data, p-values, Student's t-test. (D) and (E) Immunohistochemical staining of CD8 positive cells (cytotoxic T-lymphocytes and NK cells) (D) and MHC class II Ia positive cells (B-lymphocytes, dendritic cells and macrophages) (E), pictures display representative staining from the periphery of a tumor treated with hyperthermia, percentage of positive cells displayed in the graphs. Pictures taken at x400 resolution, 25 µm scale bar. The figures have been proportionally adjusted in size after composition. No other adjustments of pictures.

Table II.  GO biological processes overrepresented (p < 0.05) in a cluster of 1213 genes differently expressed (SAM analysis) after hyperthermia in a rat glioblastoma like tumor model.

Table III.  Selected biological processes representing five main groups of GO terms overrepresented after HT.

Figure 3. Real time RT-PCR results in vivo (A–D) and in vitro (E–H). All samples are expressed as ratios of concentration of probe of interest versus a control probe, adjusted so that the mean of the controls at the first time point (in vitro) or all time points (in vivo) equals one. (I) statistical results in vitro, p-values from Student's t-test are presented.
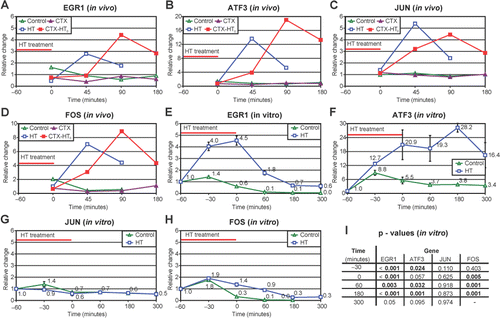
Figure 3. Real time RT-PCR results in vivo (A–D) and in vitro (E–H). All samples are expressed as ratios of concentration of probe of interest versus a control probe, adjusted so that the mean of the controls at the first time point (in vitro) or all time points (in vivo) equals one. (I) statistical results in vitro, p-values from Student's t-test are presented.

Figure 4. Tentative diagram for the interaction between DUSP1 and HSPs. The diagram has been simplified for illustrative purposes. See text for details. P; phosphorylated, T; transcription.
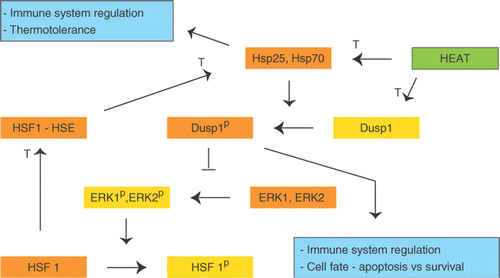
Figure 4. Tentative diagram for the interaction between DUSP1 and HSPs. The diagram has been simplified for illustrative purposes. See text for details. P; phosphorylated, T; transcription.

Reprints and Corporate Permissions

Please note: Selecting permissions does not provide access to the full text of the article, please see our help page How do I view content?

To request a reprint or corporate permissions for this article, please click on the relevant link below:

Academic Permissions

Please note: Selecting permissions does not provide access to the full text of the article, please see our help page How do I view content?

Obtain permissions instantly via Rightslink by clicking on the button below:

If you are unable to obtain permissions via Rightslink, please complete and submit this Permissions form. For more information, please visit our Permissions help page.