Figures & data
Table I. Flowchart for treatment and sample collection.
Figure 1. Supervised screen of microarrays for selected genes found in leucocytes. Selection based upon previous report of genes found differentially expressed first three hours after HT treatment Citation[1]. Two tumors harvested at each time interval, denoted a and b. Statistical analysis: statistical analysis of microarrays (SAM); HT/CTX-HT0 treated tumors compared to controls/CTX treated tumors; 26.857 genes analyzed; log2 expressed single channel data. Blank spots indicate missing data.
![Figure 1. Supervised screen of microarrays for selected genes found in leucocytes. Selection based upon previous report of genes found differentially expressed first three hours after HT treatment Citation[1]. Two tumors harvested at each time interval, denoted a and b. Statistical analysis: statistical analysis of microarrays (SAM); HT/CTX-HT0 treated tumors compared to controls/CTX treated tumors; 26.857 genes analyzed; log2 expressed single channel data. Blank spots indicate missing data.](/cms/asset/493e21d8-e182-4fda-861e-e24e7eed9ea9/ihyt_a_339962_f0001_b.gif)
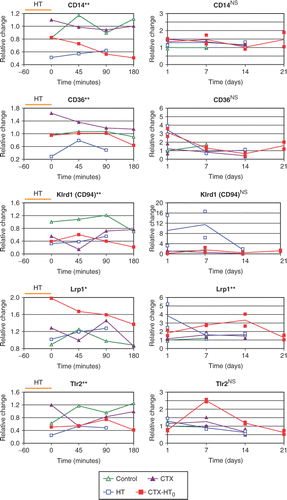
Figure 2. Quantitative PCR results from tumors harvested 0, 45, 90 and 180 min after end of treatment the first day (day 0) and from tumors harvested at days 1, 7, 14 and 21. All samples are expressed as ratios of concentration of probe versus a control probe, adjusted so that the mean of the controls at the first time-point equals one. Statistical analysis: HT/CTX-HT0 treated tumors compared to controls/CTX treated tumors; **p < 0.01; *p < 0.05; Student's t test.
