642
Views
18
CrossRef citations to date
0
Altmetric
Original

Numerical study on thermal field of microwave ablation with water-cooled antenna

, , &
Pages 108-115 | Received 13 May 2008, Accepted 28 Oct 2008, Published online: 09 Jul 2009

Figures & data

Figure 1. Ablation antenna geometry.

Figure 1. Ablation antenna geometry.

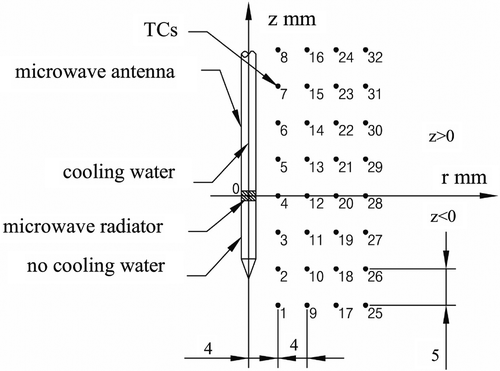
Figure 2. Antenna and thermocouple (TC) in the phantom.

Figure 2. Antenna and thermocouple (TC) in the phantom.

Table I.  Fitted coefficients of Equation 2.

Figure 3. Geometric modeling. A coaxial slot antenna was inserted in the phantom along the z-axis. The radius of the antenna was 0.95 mm. The dimension was directly labeled and every boundary condition was named as L1 ∼ L5.
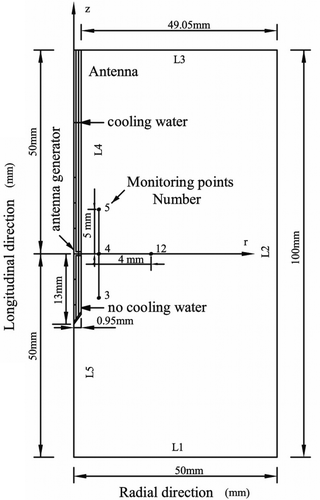
Figure 3. Geometric modeling. A coaxial slot antenna was inserted in the phantom along the z-axis. The radius of the antenna was 0.95 mm. The dimension was directly labeled and every boundary condition was named as L1 ∼ L5.

Table II.  Nu and h of the different velocities.

Table III.  Phantom ingredients (%).

Table IV.  Physical parameters of the phantom.

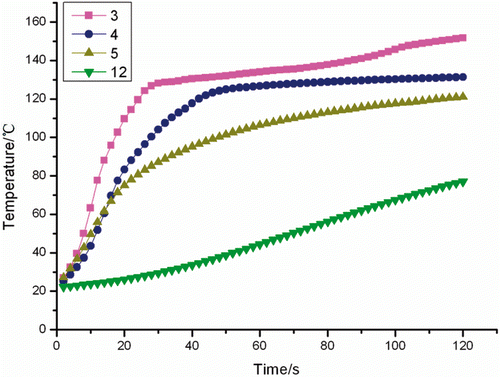
Figure 4. Transient temperatures for monitoring points 3, 4, 5, 12 in the simulation.

Figure 4. Transient temperatures for monitoring points 3, 4, 5, 12 in the simulation.

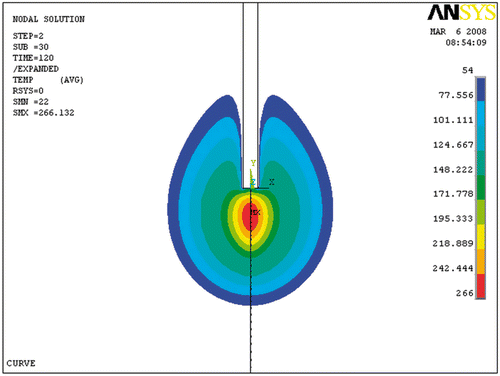
Figure 5. Ablation pattern at 54°C in the simulation.

Figure 5. Ablation pattern at 54°C in the simulation.

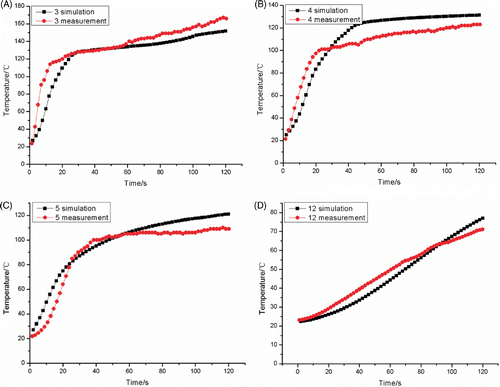
Figure 6. Transient temperatures for monitoring points 3 (A), 4 (B), 5 (C), 12 (D).

Figure 6. Transient temperatures for monitoring points 3 (A), 4 (B), 5 (C), 12 (D).

Table V.  R-sq between simulation and experiment.

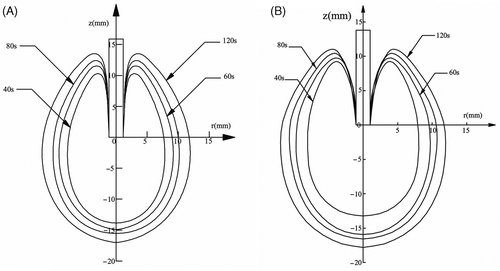
Figure 7. Ablation patterns at 54°C contours in the simulation (A) and the experiment (B).

Figure 7. Ablation patterns at 54°C contours in the simulation (A) and the experiment (B).

Table VI.  Comparison of the coagulation region.
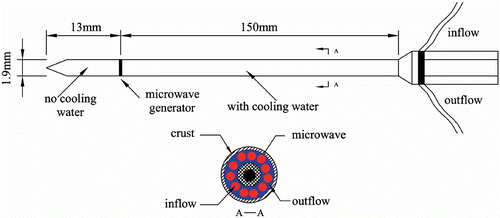
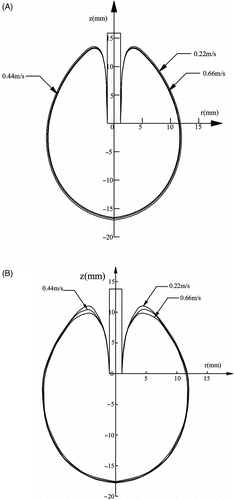
Figure 8. Ablation lesions (54°C contours) at 60 W and 120 s in the simulation (A) and experiment (B) at the cooling water velocity of 0.22 m/s, 0.44 m/s, 0.66 m/s.

Figure 8. Ablation lesions (54°C contours) at 60 W and 120 s in the simulation (A) and experiment (B) at the cooling water velocity of 0.22 m/s, 0.44 m/s, 0.66 m/s.

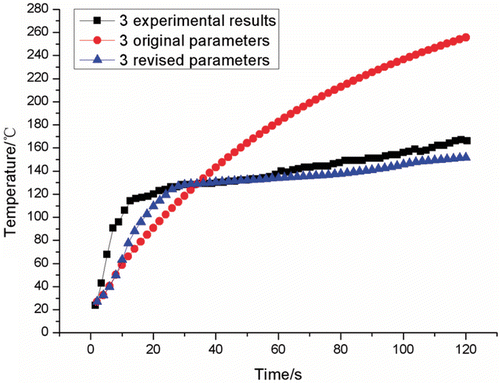
Figure 9. Comparison of numerical results (original parameters and revised parameters) with experimental results at the flow velocity of 0.22 m/s (monitoring point 3)).

Figure 9. Comparison of numerical results (original parameters and revised parameters) with experimental results at the flow velocity of 0.22 m/s (monitoring point 3)).

Reprints and Corporate Permissions

Please note: Selecting permissions does not provide access to the full text of the article, please see our help page How do I view content?

To request a reprint or corporate permissions for this article, please click on the relevant link below:

Academic Permissions

Please note: Selecting permissions does not provide access to the full text of the article, please see our help page How do I view content?

Obtain permissions instantly via Rightslink by clicking on the button below:

If you are unable to obtain permissions via Rightslink, please complete and submit this Permissions form. For more information, please visit our Permissions help page.