425
Views
15
CrossRef citations to date
0
Altmetric
Original

Use of H215O-PET for investigating perfusion changes in pelvic tumors due to regional hyperthermia

, , , , &
Pages 299-308 | Received 29 Oct 2008, Accepted 13 Jan 2009, Published online: 21 Jul 2009

Figures & data

Figure 1. 3D image after fusion with the relevant structures: CT and PET are fused in three dimensions using the surfaces of the labeled common iliac artery segment in both the CT and PET bolus images. The segmented CT common iliac artery surface is plotted in red and the PET surface in pink. The cross-section of the common iliac artery PET-label used for fusion was typically only in the range of 2-3 PET voxels. Additionally, the tumor was segmented in the CT images and the tumor VOI transferred to the PET images. The tumor surface is plotted in pink. Also, the original CT scan and a bolus PET image used for labeling are both plotted with a representative slice in their 3D fused image position.
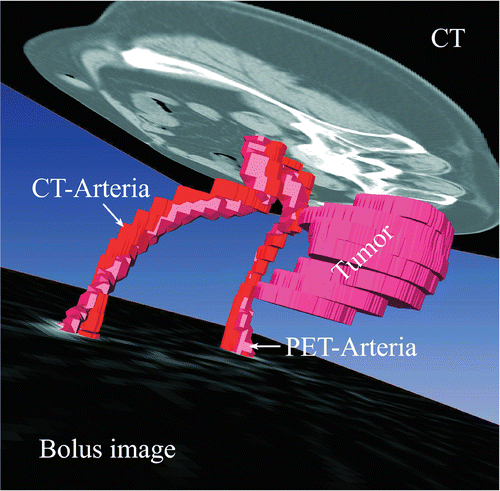
Figure 1. 3D image after fusion with the relevant structures: CT and PET are fused in three dimensions using the surfaces of the labeled common iliac artery segment in both the CT and PET bolus images. The segmented CT common iliac artery surface is plotted in red and the PET surface in pink. The cross-section of the common iliac artery PET-label used for fusion was typically only in the range of 2-3 PET voxels. Additionally, the tumor was segmented in the CT images and the tumor VOI transferred to the PET images. The tumor surface is plotted in pink. Also, the original CT scan and a bolus PET image used for labeling are both plotted with a representative slice in their 3D fused image position.

Figure 2. Labeling of the arterial and background VOIs using the bolus image.

Figure 2. Labeling of the arterial and background VOIs using the bolus image.

Figure 3. (a) Segmentation of common iliac artery and tumor in the CT. (b) Overlay of the bolus PET image averaged over 12 s on the fused CT. (c) Overlay PET image averaged over the total dynamic scan on the fused CT.
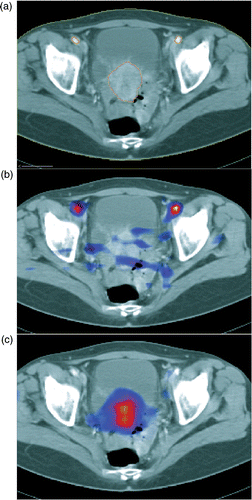
Figure 3. (a) Segmentation of common iliac artery and tumor in the CT. (b) Overlay of the bolus PET image averaged over 12 s on the fused CT. (c) Overlay PET image averaged over the total dynamic scan on the fused CT.

Figure 4. Original decay-corrected activity–time curves of the arterial (a) and background (b) VOIs shown in . Due to the restricted resolution and signal spill-over the arterial signal extracted from the common iliac artery is contaminated by the tissue signal and vice versa. Both TACs consist of the same two contributions but in different proportions. (a) The decay-corrected TAC determined from the arterial VOI, C'a(t), is plotted as filled boxes. The spill-over corrected arterial blood curve, RCa(t), is additionally shown. (b) The decay-corrected tissue TAC determined from the tissue VOI, C't(t), is plotted as filled boxes and the fitted curve as a line. The spill-over corrected tissue curve, Ct(t), is additionally shown.
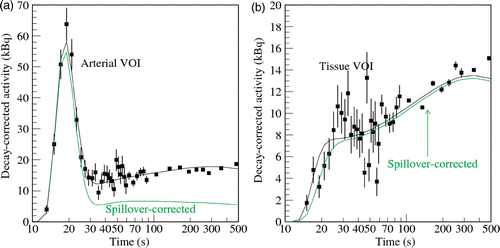
Figure 4. Original decay-corrected activity–time curves of the arterial (a) and background (b) VOIs shown in Figure 2. Due to the restricted resolution and signal spill-over the arterial signal extracted from the common iliac artery is contaminated by the tissue signal and vice versa. Both TACs consist of the same two contributions but in different proportions. (a) The decay-corrected TAC determined from the arterial VOI, C'a(t), is plotted as filled boxes. The spill-over corrected arterial blood curve, RCa(t), is additionally shown. (b) The decay-corrected tissue TAC determined from the tissue VOI, C't(t), is plotted as filled boxes and the fitted curve as a line. The spill-over corrected tissue curve, Ct(t), is additionally shown.

Table I.  Results of the measurements and therapeutic parameters.

Figure 5. For both the 15 rectal carcinomas (□) and the 12 cervical (•) carcinomas, the increase in partition coefficient depends on the heating time represented by the line of linear regression. The change in partition coefficient exhibits a more significant correlation with the heating time than the duration of the steady state temperature.
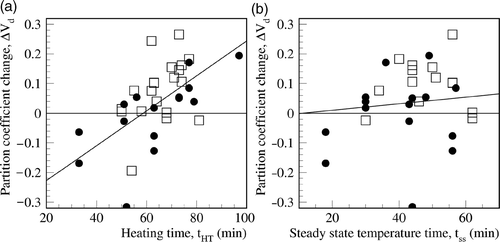
Figure 5. For both the 15 rectal carcinomas (□) and the 12 cervical (•) carcinomas, the increase in partition coefficient depends on the heating time represented by the line of linear regression. The change in partition coefficient exhibits a more significant correlation with the heating time than the duration of the steady state temperature.

Figure 6. Neither perfusion (a) nor the partition coefficient (b) correlates with the time between switching off the hyperthermia power and the PET scan, ▵t, for the 15 rectal (□) carcinomas and 12 cervical (•) carcinomas. Investigations with two measurements after hyperthermia are connected by a line. The partition coefficient is enhanced for more than 1 h after hyperthermia.
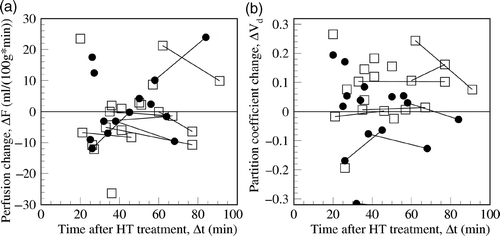
Figure 6. Neither perfusion (a) nor the partition coefficient (b) correlates with the time between switching off the hyperthermia power and the PET scan, ▵t, for the 15 rectal (□) carcinomas and 12 cervical (•) carcinomas. Investigations with two measurements after hyperthermia are connected by a line. The partition coefficient is enhanced for more than 1 h after hyperthermia.

Figure 7. The increase in partition coefficient significantly depends on the numbers of treatments, N, (A) and the time after the first hyperthermia, tTh (B), for the 15 rectal (□) carcinomas and 12 cervical (•) carcinomas demonstrated by the line of linear regression. The increase of the partition coefficient is reduced with an increasing number of therapy sessions.
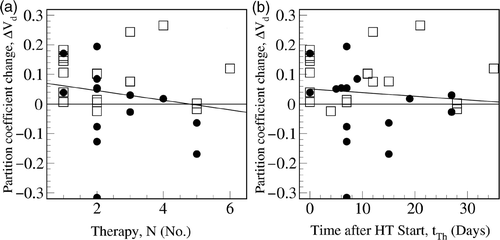
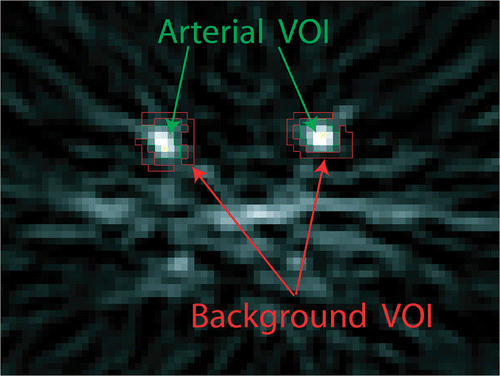
Figure 7. The increase in partition coefficient significantly depends on the numbers of treatments, N, (A) and the time after the first hyperthermia, tTh (B), for the 15 rectal (□) carcinomas and 12 cervical (•) carcinomas demonstrated by the line of linear regression. The increase of the partition coefficient is reduced with an increasing number of therapy sessions.

Reprints and Corporate Permissions

Please note: Selecting permissions does not provide access to the full text of the article, please see our help page How do I view content?

To request a reprint or corporate permissions for this article, please click on the relevant link below:

Academic Permissions

Please note: Selecting permissions does not provide access to the full text of the article, please see our help page How do I view content?

Obtain permissions instantly via Rightslink by clicking on the button below:

If you are unable to obtain permissions via Rightslink, please complete and submit this Permissions form. For more information, please visit our Permissions help page.