Figures & data
Figure 1. A schematic representation of our experimental protocols. Monolayers of cells were exposed to a first heat treatment and then incubated at 37°C for 0–72 h. At various times after the first heat treatment, (a) cells were heated at 45°C for 45 min and the survival levels determined; (b) cells were labelled with [35S]methionine at 37°C for 1 h and cellular proteins analysed by gel electrophoresis; (c) cells were given a second heat dose (43.5°C for 15 min), labelled with [35S]methionine at 37°C for 1 h, and then the cellular proteins were analysed.
![Figure 1. A schematic representation of our experimental protocols. Monolayers of cells were exposed to a first heat treatment and then incubated at 37°C for 0–72 h. At various times after the first heat treatment, (a) cells were heated at 45°C for 45 min and the survival levels determined; (b) cells were labelled with [35S]methionine at 37°C for 1 h and cellular proteins analysed by gel electrophoresis; (c) cells were given a second heat dose (43.5°C for 15 min), labelled with [35S]methionine at 37°C for 1 h, and then the cellular proteins were analysed.](/cms/asset/49cdff8b-6250-471f-b4a9-4d6344c288af/ihyt_a_392666_f0001_b.gif)
Figure 2. An autoradiograph of [35S]methionine labelled proteins obtained in one set of experiments. SQ-1 cells were exposed to 41°C for 4 h, incubated at 37°C for various time periods, and (a) labelled, (b) or heated at 43.5° for 15 min, and then labelled. Lanes are designated by the time period (in number of hours) for which the cells were placed at 37°C; lanes representing (b) are marked with an additional subscript Δ. The lanes marked C and CΔ are for control cells, i.e. cells which did not receive a priming heat dose.
![Figure 2. An autoradiograph of [35S]methionine labelled proteins obtained in one set of experiments. SQ-1 cells were exposed to 41°C for 4 h, incubated at 37°C for various time periods, and (a) labelled, (b) or heated at 43.5° for 15 min, and then labelled. Lanes are designated by the time period (in number of hours) for which the cells were placed at 37°C; lanes representing (b) are marked with an additional subscript Δ. The lanes marked C and CΔ are for control cells, i.e. cells which did not receive a priming heat dose.](/cms/asset/5c404dca-ec0a-489e-b2a1-830ae6c1126b/ihyt_a_392666_f0002_b.gif)
Figure 3. Rate of HSP synthesis of thermotolerant cells before and after exposure to a test heat shock. Left panel: kinetics of hsp70 synthesis. The open circles represent rates of hsp70 synthesis at various times after the priming dose of 4 h at 41°C. The solid circles are rates of hsp70 synthesis following the second heat dose (15 min at 43.5°C). These latter data measured the response of cells to a second heat treatment, in terms of their ability to re-initiate the synthesis of additional hsp70 during the decay of thermotolerance induced by the first priming heat shock. Right panel: Similar measurements performed for hsp87. For both panels, rates were calculated by taking the ratio of the peak height of hsp70 or hsp87 peak to that of actin.
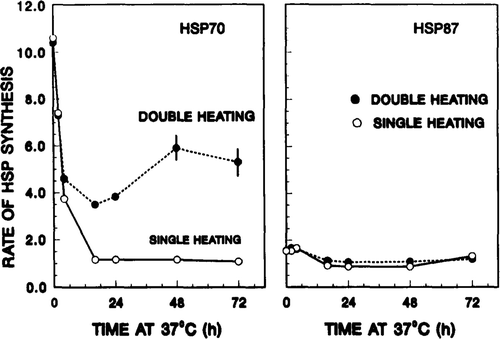
Figure 4. Rate of hsp70 synthesis after the second heat shock inversely correlates with the decay of thermotolerance. Left panel: SQ-1 cell survival resulting from a second heat treatment (45 min at 45°C) at various times after the 41°C, 4 h priming dose. The 41°C, 4 h treatment reduced survival to 60 per cent. The solid circle represents the survival of control cells, i.e. cells which did not receive a first heat dose. Right panel: the quantity (hsp70)TT,Δ as extracted from the data of . As defined in the text, these are the ratios of hsp70 synthesis rates for thermotolerant cells after given a test heat shock to that for cells before given the test heat dose. This ratio is an estimate of the ability of thermotolerant cells to re-initiate the synthesis of hsp70 at various stages of thermotolerance. For hsp70 the relative synthesis rate increased with 37°C incubation time after the priming dose. In contrast, no time-dependent effect was observed for hsp87.
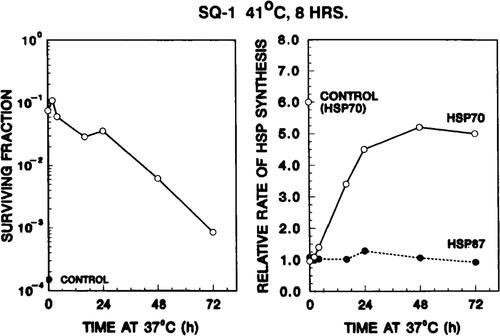
Figure 5. An autoradiograph of [35S]methionine labelled proteins obtained in a second set of experiments. SQ-1 cells were exposed to 41°C for 8 h, incubated at 37°C for various periods, and (a) labelled, or (b) heated at 43.5° for 15 min, and then labelled. Lanes are designated by the time period (in number of hours) for which the cells were placed at 37°C; lanes representing (b) are marked with an additional subscript A. The lanes marked C and CΔ are for control cells, i.e. cells which did not receive a priming heat dose.
![Figure 5. An autoradiograph of [35S]methionine labelled proteins obtained in a second set of experiments. SQ-1 cells were exposed to 41°C for 8 h, incubated at 37°C for various periods, and (a) labelled, or (b) heated at 43.5° for 15 min, and then labelled. Lanes are designated by the time period (in number of hours) for which the cells were placed at 37°C; lanes representing (b) are marked with an additional subscript A. The lanes marked C and CΔ are for control cells, i.e. cells which did not receive a priming heat dose.](/cms/asset/4e016dc7-c988-469a-9376-cfba81eef5a4/ihyt_a_392666_f0005_b.gif)
Figure 6. Rate of hsp70 synthesis of thermotolerant cells after the second test heat shock inversely correlates with the decay of thermotolerance. Left panel: development and decay of thermotolerance after a priming heat dose at 41°C for 8 h. The 41°C, 8 h treatment reduced survival to 30 per cent. Right panel: ability of thermotolerant SQ-1 cells to re-initiate the synthesis of additional hsp70 in response to a second heat dose. For detailed description see .
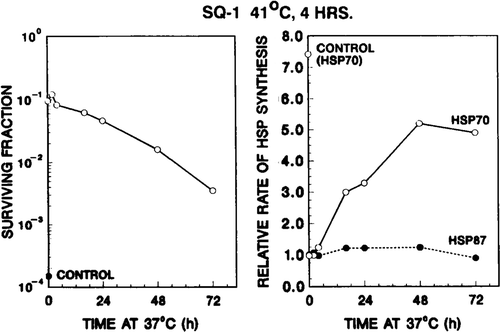
Figure 7. Autoradiogram of a two-dimensional gel showing the enhanced synthesis of hsp70 in heat shocked human tumour HCT-8 cells in vitro. Monolayers of HCT-8 cells were heated at 45°C for 15 min, labelled at 37°C for 4 h, and cellular proteins analysed. First dimension (IEF) was from left to right, and the second dimension was from top to bottom. Three members of hsp70 family were identified: (a) hsp70-a; (b) hsp70-b; and (c) hsp70-c. The protein synthesis profile of non-heated control was shown in the left panel. The heat shock enhanced the expression of hsp70-b and induced that of hsp70-c.
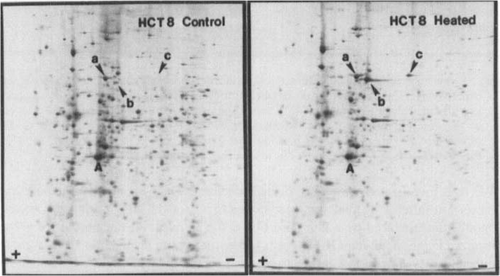
Figure 8. Autoradiograms of two-dimensional gels showing the ability of thermotolerant HCT-8 cells to re-initiate the synthesis of hsp70 after a test heat dose. HCT-8 cells were exposed to a first heat treatment at 45°C for 30 min, returned to 37°C incubation for 4–72 h, and labelled (for 4 h) either before or after a second test heat dose (45°C for 15 min). Left panels (top to bottom): control non-tolerant cells, 4, 8, 48, 72-h thermotolerant cells; all were labelled without receiving the second test heat shock. Right panels (top to bottom): control non-tolerant cells, 4, 8, 48, 72-h thermotolerant cells; all cells were labelled immediately after receiving the second test heat shock (45°C, 15 min).
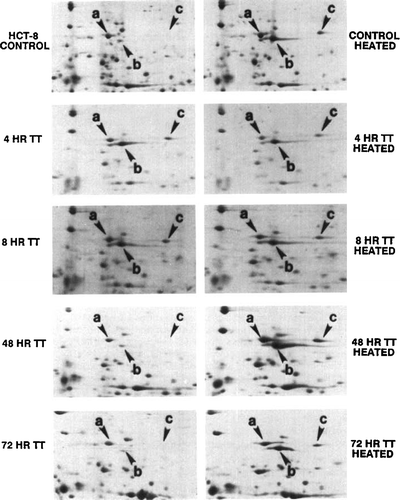
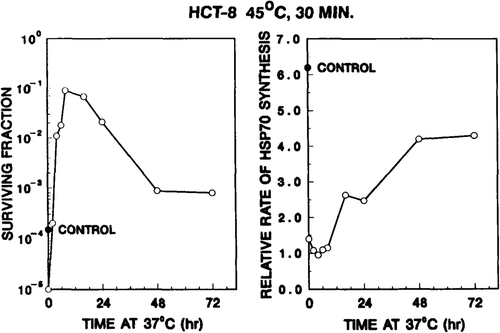
Figure 9. Ability of thermotolerant HCT-8 cells to re-initiate the synthesis of hsp70 inversely correlates with the decay of thermotolerance. Left panel: HCT-8 cell survival resulting from a second heat treatment (75 min at 45°C) at various times after the 45°C, 30 min priming dose. The 45°C, 30 min priming treatment reduced survival to ∼15 per cent. The solid circle represents the survival of control cells, i.e. cells did not receive a first heat dose. Right panel: relative rate of hsp70 synthesis, in response to a second heat shock (45°C for 15 min), were calculated from densitometer tracings of one-dimensional gels, as described in Materials and methods section.