1,035
Views
22
CrossRef citations to date
0
Altmetric
Research Article

Metamaterial lens applicator for microwave hyperthermia of breast cancer

&
Pages 434-445 | Received 06 Sep 2008, Accepted 21 May 2009, Published online: 09 Sep 2009

Figures & data

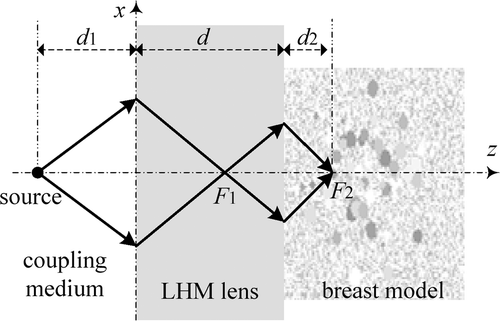
Figure 1. Focusing of flat LHM lens in the breast model.

Figure 1. Focusing of flat LHM lens in the breast model.

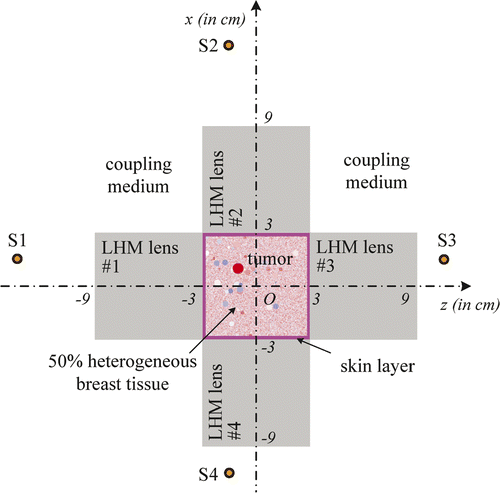
Figure 2. Hyperthermia system with four LHM lenses.

Figure 2. Hyperthermia system with four LHM lenses.

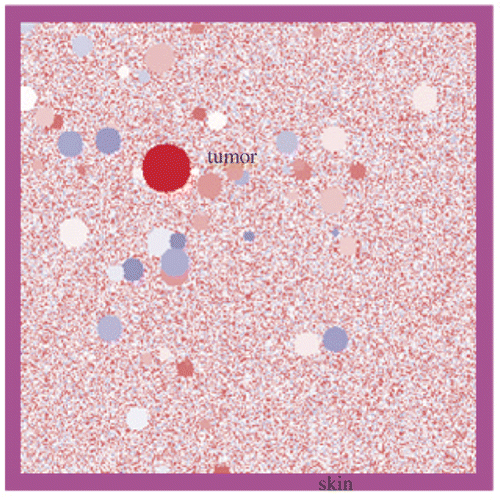
Figure 3. Heterogeneous breast model used in our simulation.

Figure 3. Heterogeneous breast model used in our simulation.

Figure 4. Focusing of the LHM lens system: (A) Image of the focusing, (B) Profile of field distribution, and (C) Source waveform.

Figure 4. Focusing of the LHM lens system: (A) Image of the focusing, (B) Profile of field distribution, and (C) Source waveform.

Figure 5. Power deposition and temperature distribution of hyperthermia of a 6 mm tumour centred at (0, 0): (A) Power deposition, and (B) Temperature distribution.
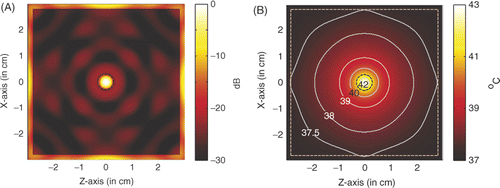
Figure 5. Power deposition and temperature distribution of hyperthermia of a 6 mm tumour centred at (0, 0): (A) Power deposition, and (B) Temperature distribution.

Table I.  Thermal constants suggested for the BHTE Citation[18].

Figure 6. Temperature rise with heating time at the centre of the tumour and right outside the tumour.
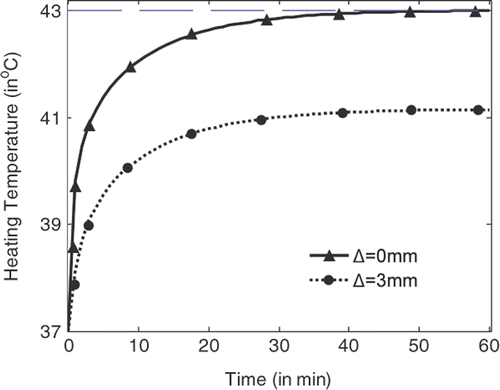
Figure 6. Temperature rise with heating time at the centre of the tumour and right outside the tumour.

Figure 7. Power deposition and temperature distribution of hyperthermia of a 6 mm tumour centred at (1, −1): (A) Power deposition, and (B) Temperature distribution.
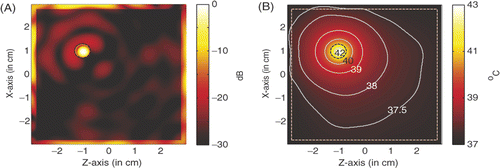
Figure 7. Power deposition and temperature distribution of hyperthermia of a 6 mm tumour centred at (1, −1): (A) Power deposition, and (B) Temperature distribution.

Figure 8. Temperature rise with heating time at the centre of tumour and right outside the tumour.

Figure 8. Temperature rise with heating time at the centre of tumour and right outside the tumour.

Figure 9. Power deposition and temperature distribution of hyperthermia of a 12 mm tumour centred at (1, −1): (A) Power deposition, (B) Temperature distribution, and (C) Temperature in tumour.

Figure 9. Power deposition and temperature distribution of hyperthermia of a 12 mm tumour centred at (1, −1): (A) Power deposition, (B) Temperature distribution, and (C) Temperature in tumour.

Figure 10. Temperature rise with heating time at the centre of tumour and right outside the tumour.

Figure 10. Temperature rise with heating time at the centre of tumour and right outside the tumour.

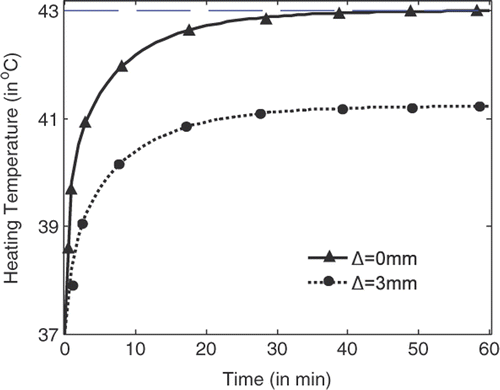
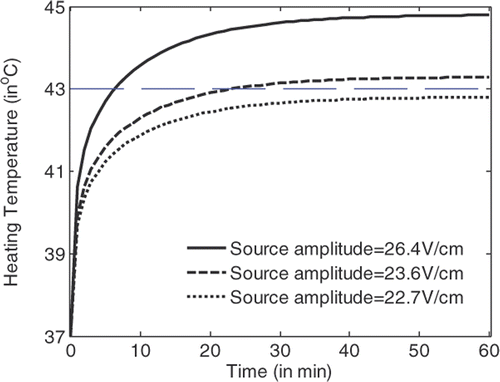
Figure 11. Temperature rise with the heating time for hyperthermia with a LHM lens applicator of .

Figure 11. Temperature rise with the heating time for hyperthermia with a LHM lens applicator of .

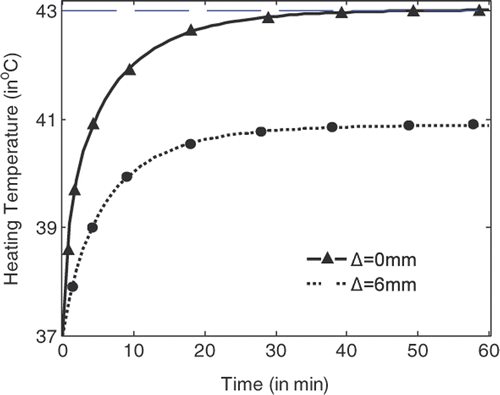
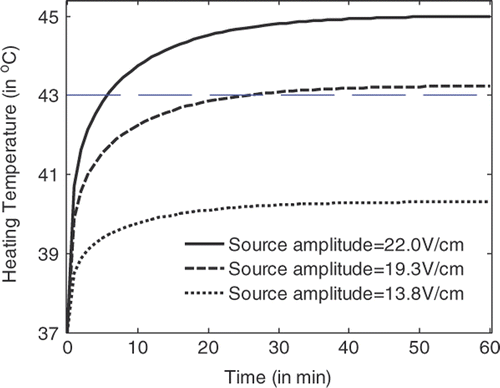
Figure 12. Temperature rise with the heating time for hyperthermia with a LHM lens applicator of .

Figure 12. Temperature rise with the heating time for hyperthermia with a LHM lens applicator of .

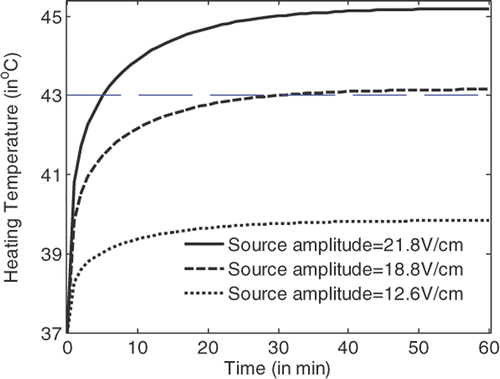
Figure 13. Temperature rise with the heating time for hyperthermia with a LHM lens applicator of .

Figure 13. Temperature rise with the heating time for hyperthermia with a LHM lens applicator of .

Figure 14. Hyperthermia of tumour in a circular breast model with four LHM lenses: (A) The system, and (B) Circular breast model.
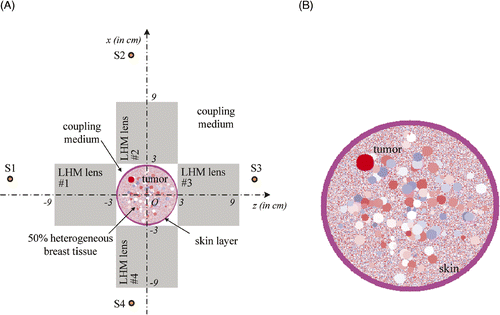
Figure 14. Hyperthermia of tumour in a circular breast model with four LHM lenses: (A) The system, and (B) Circular breast model.

Figure 15. Power and temperature distribution of hyperthermia of a 6 mm tumour centred at (1.5, −1.5): (A) Power deposition, and (B) Temperature distribution.
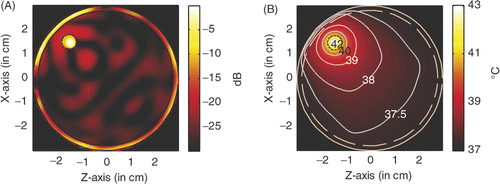
Figure 15. Power and temperature distribution of hyperthermia of a 6 mm tumour centred at (1.5, −1.5): (A) Power deposition, and (B) Temperature distribution.

Figure 16. Power and temperature distribution of hyperthermia of a 6 mm tumour with 6 GHz microwave: (A) Power deposition, and (B) Temperature distribution.
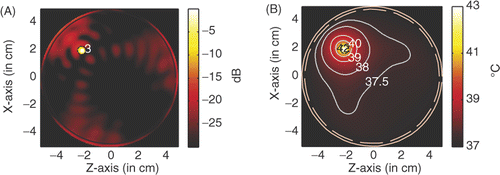
Figure 16. Power and temperature distribution of hyperthermia of a 6 mm tumour with 6 GHz microwave: (A) Power deposition, and (B) Temperature distribution.

Figure 17. Power and temperature distribution of hyperthermia of a 6 mm tumour with 2.45 GHz microwave: (A) Power deposition, and (B) Temperature distribution.
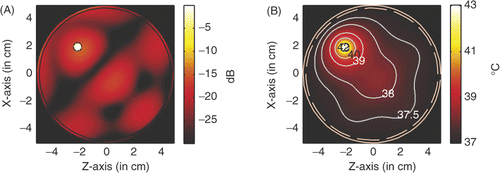
Figure 17. Power and temperature distribution of hyperthermia of a 6 mm tumour with 2.45 GHz microwave: (A) Power deposition, and (B) Temperature distribution.

Table II.  Hyperthermia performance of a 6 mm tumour.

Figure 18. Power and temperature distribution of hyperthermia of a 20 mm tumour with 6 GHz microwave: (A) Power deposition, and (B) Temperature distribution.
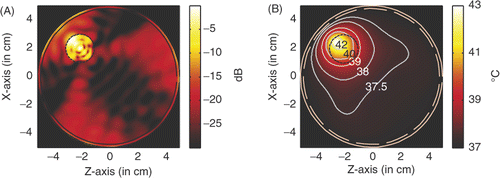
Figure 18. Power and temperature distribution of hyperthermia of a 20 mm tumour with 6 GHz microwave: (A) Power deposition, and (B) Temperature distribution.

Figure 19. Power and temperature distribution of hyperthermia of a 20 mm tumour with 2.45 GHz microwave: (A) Power deposition, and (B) Temperature distribution.
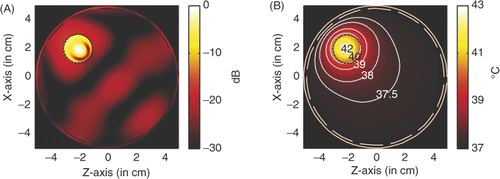
Figure 19. Power and temperature distribution of hyperthermia of a 20 mm tumour with 2.45 GHz microwave: (A) Power deposition, and (B) Temperature distribution.

Table III.  Hyperthermia performance of a 20 mm tumour.
Reprints and Corporate Permissions

Please note: Selecting permissions does not provide access to the full text of the article, please see our help page How do I view content?

To request a reprint or corporate permissions for this article, please click on the relevant link below:

Academic Permissions

Please note: Selecting permissions does not provide access to the full text of the article, please see our help page How do I view content?

Obtain permissions instantly via Rightslink by clicking on the button below:

If you are unable to obtain permissions via Rightslink, please complete and submit this Permissions form. For more information, please visit our Permissions help page.