
Figures & data
Figure 1. Geometry of the model used in the study (out of scale, dimensions in mm). The outer dimensions (60 mm wide and 150 mm long) were calculated by means of a convergence test (see text for more details). The active electrode is labelled as ‘electrode’ while the dispersive electrode is really modelled as a boundary condition (zero voltage) applied at the top and bottom surfaces of the model.
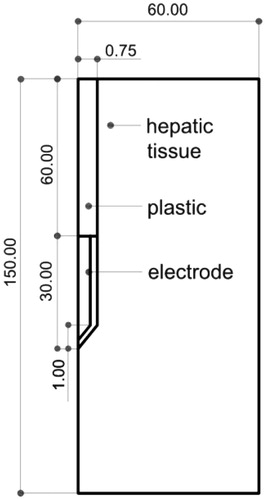
Table 1. Characteristics of the materials used in the theoretical model [Citation14–16].
Table 2. Coagulation zone diameters (in cm) computed finite element method (FEM) for different current values and tissue conditions (temperature and blood perfusion). Values reported in previous experimental studies are also included [Citation3,Citation13,Citation24–26].
Figure 2. Evolution of voltage, impedance and power during a 12-min RFA using pulses of 1500 mA in the in vivo case.
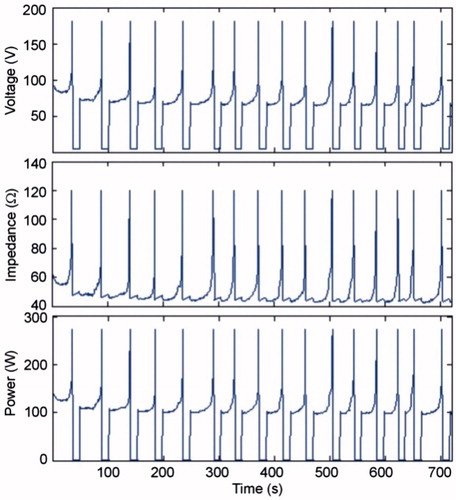
Figure 3. Effect of amplitude of current pulses and tissue conditions on the time of first roll-off and tON at the end of the 12-min RFA.
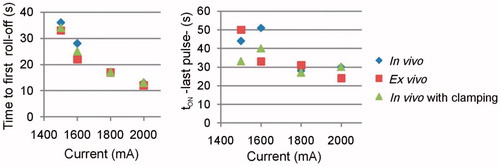
Figure 4. Current, impedance and power evolution during a 12-min RFA using 90-V pulses and a non-optimised pulsing protocol (in vivo plots).
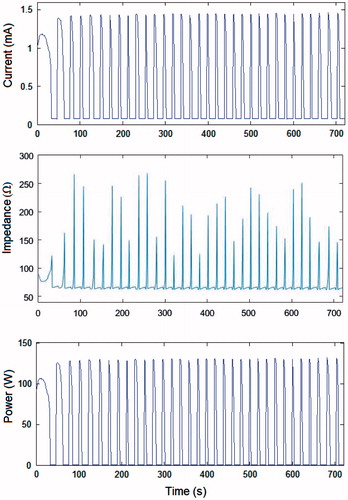
Figure 5. Voltage, current, impedance and power evolution during a 12-min RFA using 90-V pulses and an optimised pulsing protocol (in vivo plots). Note that the amplitude of the voltage pulses progressively decreased from 90 V to 65 V in order to keep tON longer than 10 s throughout the 12-min ablation.
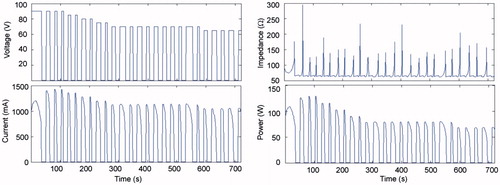
Figure 6. Effect of voltage amplitude on the time of first roll-off and tON at the end of the 12-min RFA, for optimised and non-optimised pulsing protocols.
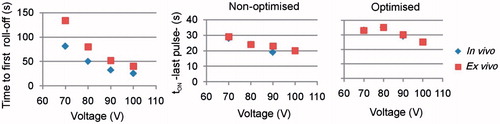
Figure 7. Coagulation zone diameters at different voltages in vivo at 37 °C and ex vivo at 21 °C and non-optimised and optimised pulsing protocols.
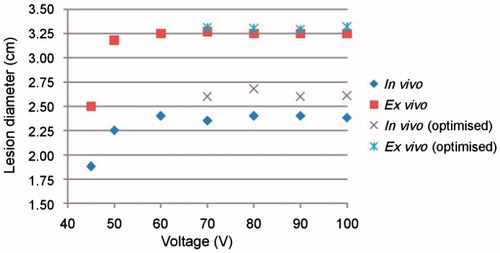
Table 3. Coagulation zone diameters (in cm) computed for different voltage values and tissue conditions.
Figure 8. Evolution with time of thermal diameter throughout 12 min of RFA for three cases in which 90-V pulses were applied in an impedance-controlled mode: in vivo with and without blood perfusion and tissue temperature of 37 °C, and ex vivo (without blood perfusion and tissue temperature of 21 °C). Note that the coagulation zone is initially larger in vivo (37 °C) than ex vivo (21 °C), but this tendency changes at the point signalled by the arrow.
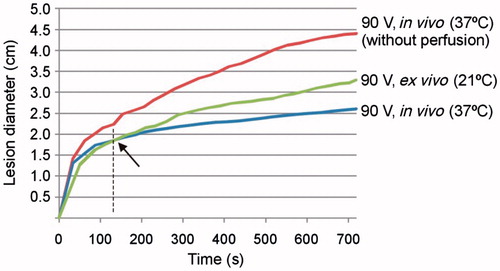
Table 4. Comparison between voltage and current pulses in terms of electrical parameters and coagulation zone diameters (in vivo case, 37 °C, with blood perfusion).