
Figures & data
Table 1. Patient demographics and descriptive data.
Table 2. Procedure characteristics.
Table 3. Tumour marker measurement before and after treatment.
Figure 1. Kaplan–Meier survival curves after treatment with CRS combined with HIPEC. (A) Overall survival of gastric cancer patients subjected to HIPEC. (B) Overall survival of gastric cancer patients subjected to curative and palliative procedures. (C) Overall survival of gastric cancer patients with or without ascites. (D) Overall survival of gastric cancer patients with stages III and IV (P < 0.01, Stage IV vs. Stage III). (E) Overall survival of gastric cancer patients with CCR-0, 1 and -3 (P = 0.002, CCR-0 vs. CCR >0).
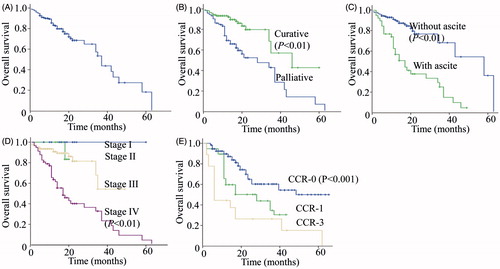
Table 4. Summary of multivariate analysis of overall survival duration in all patients.
Table 5. Complication profiles of patients subjected to cytoreductive surgery combined with HIPEC treatment.