
Figures & data
Figure 1. Monitoring ultrasound images obtained from a 42-year-old patient with an anteverted uterus. The bladder was filled with 150 mL of normal saline. (A) Pre-HIFU ultrasound image showed a 4.3 × 4.0 × 3.8 cm uterine fibroid located at the anterior wall of the uterus (arrow). (B) Intra-HIFU ultrasound image showed a significant greyscale change area in the fibroids (arrow).
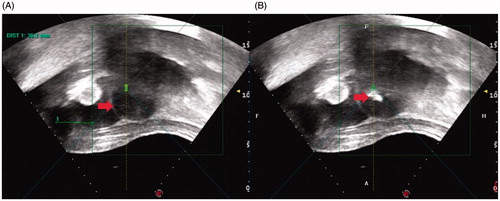
Figure 2. Monitoring ultrasound images obtained from a 39-year-old patient with a retroverted uterus. The bladder was filled with 300 mL of normal saline and lay between the uterus and abdominal wall. (A) Pre-HIFU ultrasound image showed a 4.1 × 3.9 × 3.8 cm of uterine fibroid located at the posterior wall of the uterus (arrow). (B) Intra-HIFU ultrasound image showed a significant greyscale change area in the fibroids (arrow).
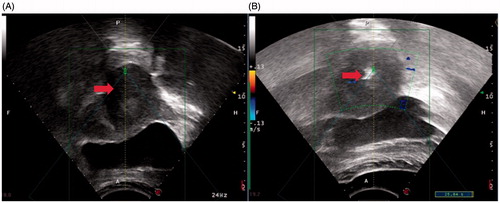
Figure 3. Contrast-enhanced MR images obtained from a patient with an anteverted uterus. (A) A pre-procedure contrast-enhanced MR image showed a 8.0 × 6.8 × 6.7 cm fibroid located at the anterior wall of the uterus (arrow). (B) Contrast-enhanced MRI obtained 1 day after HIFU showed the non-perfused volume ratio was 91% (arrow).
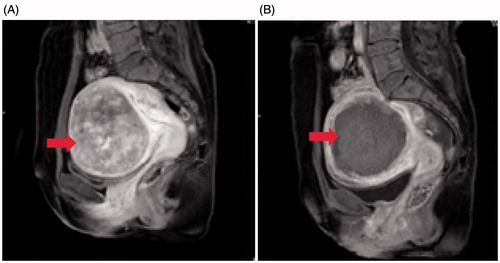
Figure 4. Contrast-enhanced MR images obtained from a patient with a retroverted uterus. (A) A pre-procedure contrast-enhanced MR image showed a 4.1 × 3.8 × 3.7 cm fibroid located at the anterior wall of the uterus (arrow). (B) Contrast-enhanced MRI obtained 1 day after HIFU showed the non-perfused volume ratio was 100% (arrow).
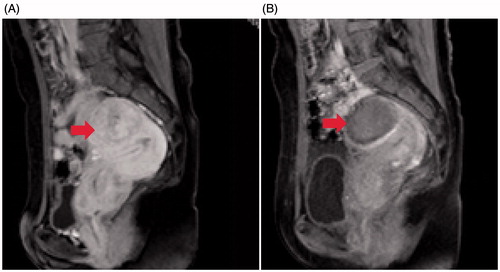
Table 1. Baseline characteristics of 442 patients with a solitary uterine fibroid in either an anteverted uterus or a retroverted uterus. Data are numbers or mean value ± SD. No significant difference was observed between the two groups (P > 0.05).
Table 2. Treatment results of HIFU for patients with fibroids in an anteverted uterus or a retroverted uterus.
Table 3. Incidence rates of adverse effects during the HIFU procedure. No significant difference was observed between the two groups (P > 0.05).
Table 4. Incidence rates of adverse effects and complications immediately after HIFU treatment. Skin burn was observed in five (2.3%) patients with a retroverted uterus; Resection was performed in two of them. One patient with a retroverted uterus reported leg pain.