Figures & data
Figure 1. The blood–retinal barrier. Schematics of a small capillary in the retina.
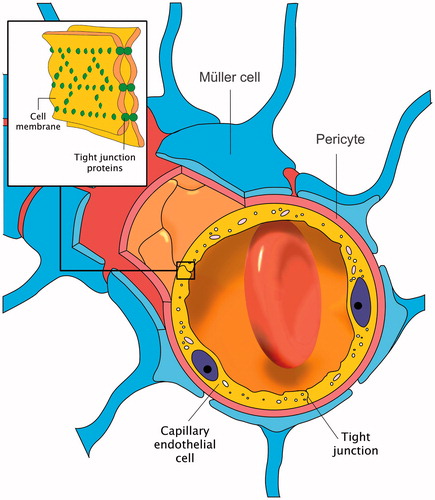
Figure 2. Transmission electron microscopy (TEM) image from commercially available Chemicell Tf-MNPs. This image was acquired on a Jeol JEM-2100 field-emission gun at École Polytechnique de Montréal, Canada. The magnetite particles have a relatively widespread size distribution ranging approximately from 8 to 20 nm in diameter.
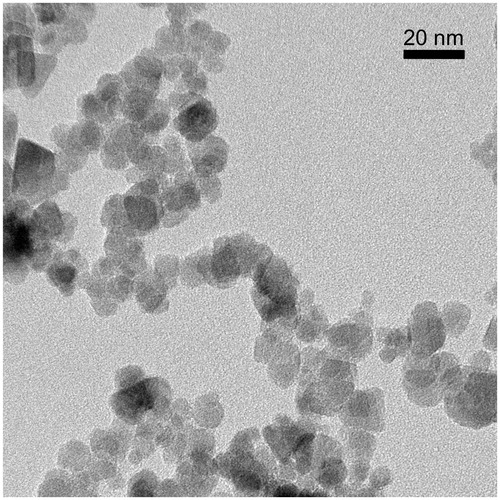
Figure 3. Animal protocol. The experimental procedure for each group is schematically presented in this figure. Note that only the hyperthermia and recovery groups received elevation of temperature.
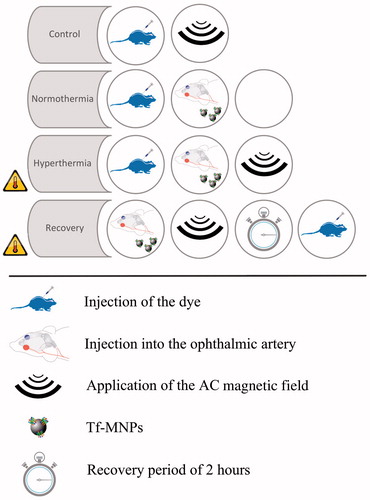
Figure 4. Experimental procedure. The Tf-MNPs reach the left retina through the pterygopalatine artery. Traces of Evans blue dye and sodium fluorescein are detected on extracted retinas for the hyperthermia group.
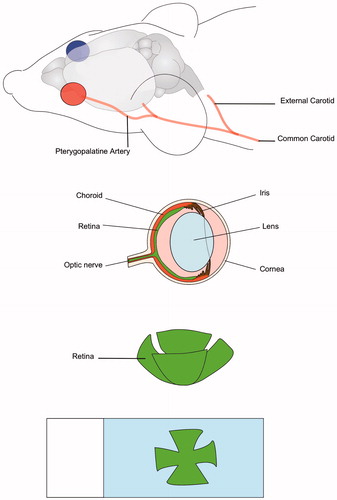
Figure 5. Sodium fluorescein (NaF) extravasation across the blood-retinal barrier after hyperthermia (n = 20, five in each group). This graph represents the relative fluorescence unit (RFU) due to penetration of NaF dye in the retinal tissue as measured with a spectrofluorometer. These values are normalised and computed using one-way ANOVA followed by Tukey’s multiple comparison test. As expected, the hyperthermia group (****p < 0.0001 vs. normothermia) has the highest RFU value. Hyperthermia is also significantly higher than the control (****p < 0.0001), and recovery groups (****p < 0.0001). Error bars represent standard error of mean (SEM).
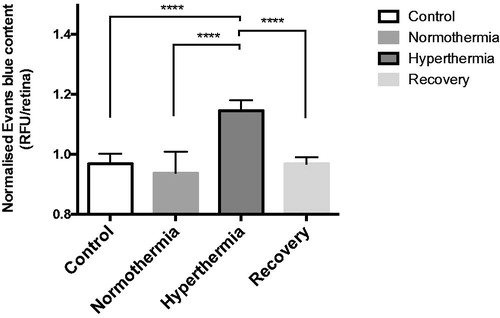
Figure 6. Evans blue dye extravasation across the blood–retinal barrier after hyperthermia (n = 12, three in each group). In this study the left eye was the target site and the contralateral right eye was used to normalise the data. The ratio of the difference in the luminescence intensity between the two eyes with respect to the size of the retina was defined as the amount of fluorescence for each particular group. Statistical analysis was done using one-way ANOVA followed by Tukey's multiple comparison test. As expected, the hyperthermia group (***p < 0.001 vs. normothermia) had the highest RFU value. Hyperthermia was also significantly higher than the control (***p < 0.001), and recovery groups (***p < 0.001). Error bars represent SEM.
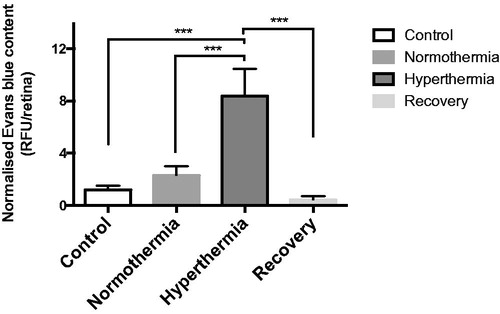
Figure 7. Temperature increase as function of distance. This illustration reveals that elevation of temperature for 30 min from a single particle (R = 14 nm) is extremely local and it is close to zero after 1 μm away from the particle. This software simulation is based on the thermal conductivity of the bilayer lipid [Citation42] and the thermodynamics of the thermal release from a single particle during hyperthermia [Citation33]. The specific absorption rate is set to 21.9 kW/m3.
![Figure 7. Temperature increase as function of distance. This illustration reveals that elevation of temperature for 30 min from a single particle (R = 14 nm) is extremely local and it is close to zero after 1 μm away from the particle. This software simulation is based on the thermal conductivity of the bilayer lipid [Citation42] and the thermodynamics of the thermal release from a single particle during hyperthermia [Citation33]. The specific absorption rate is set to 21.9 kW/m3.](/cms/asset/1e88650e-b990-46e4-ae85-289743e098fe/ihyt_a_1193903_f0007_c.jpg)
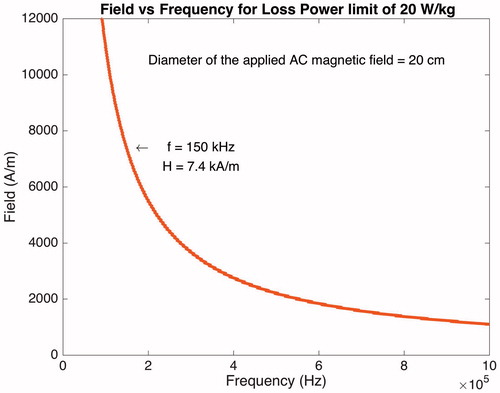
Figure 8. Biological limitation to field and frequency. The SAR value in this figure is 21.90 × 10³ W/m3.