Figures & data
Figure 1. The parathyroid nodule presents a hypoechoic signal before MWA (A). The ablation needle was inserted into the parathyroid tissue under ultrasound guidance (B).
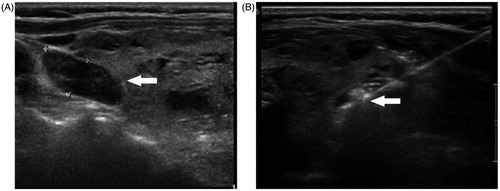
Table 1. Comparison between the two groups regarding possible predictors.
Figure 2. ROC curve for iPTH predicting MWA efficacy for severe SHPT.
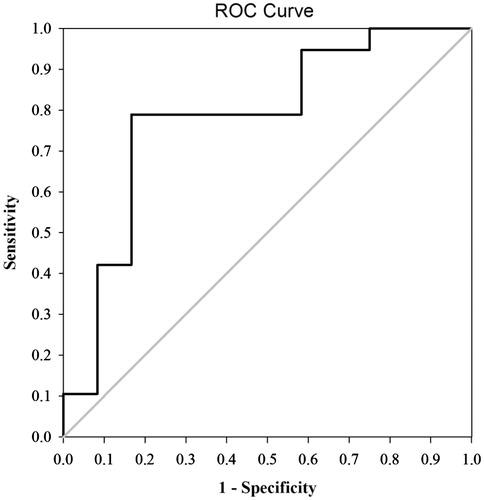
Table 2. Baseline characteristics of the study patients arranged by treatment group.
Table 3. Patient and treatment characteristics arranged by treatment group.
Figure 3. Characteristics of changes in iPTH levels arranged by treatment group. Rates of achieving the recommended goals (A) and changes in serum iPTH levels (B) arranged by treatment group. Percentage of serum iPTH levels lower than 124 pg/mL (lower limit of the target range) (C) and higher than 558 pg/mL (upper limit of the target range) (D) arranged by treatment group. *P < 0.05, compared with the PTX group. Base, baseline; w, week; m, month.
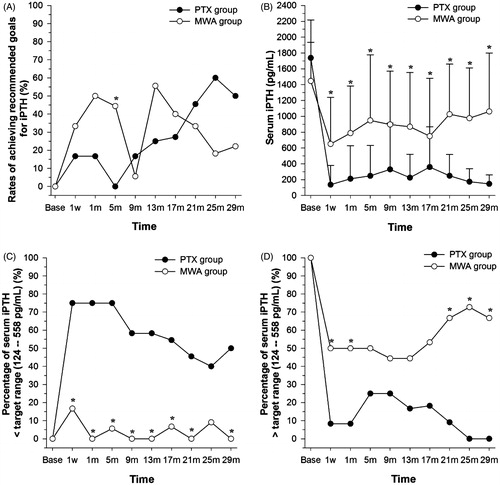
Figure 4. Rates of achieving recommended goals for serum calcium and phosphorus levels arranged by treatment group. Base, baseline; w, week; m, month.
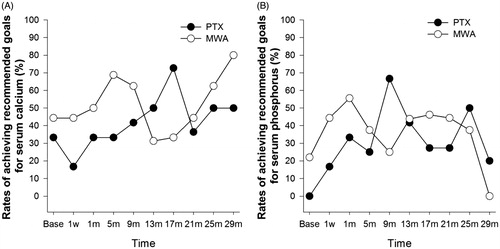
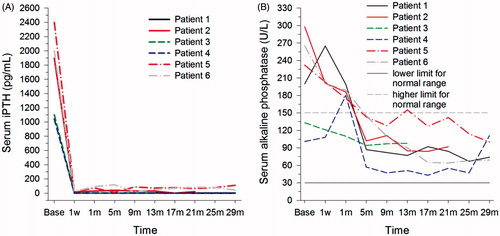
Figure 5. Changes in serum iPTH and alkaline phosphatase levels in participants with persistently low iPTH. Base: baseline; w: week; m: months.