Figures & data
Figure 1. Tissue harvesting was performed along the short and long axes of each lesion (the longitudinal plane). A hollow needle 2 mm in diameter was inserted near the MW antenna before it was pulled out. Tubular specimens were obtained, and the length and width of the ablation zone were measured.
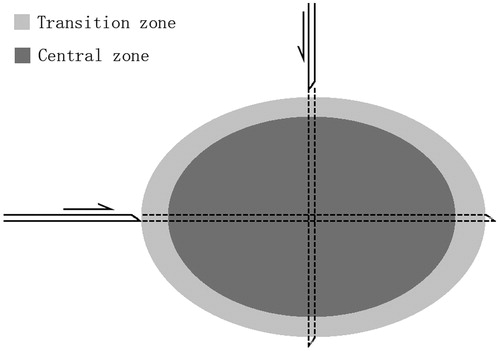
Figure 2. Schematic diagram illustrating intra-lesional plasmid injection. MW needle antennas were positioned in the left lateral lobe of the rat liver, and MW energy was delivered via the antennas. An oval lesion was generated as indicated, centred with the antennas. A total of 100 μL plasmid solution was injected into the lesion polar close to liver surface at three points 0.2 cm away from the antenna.
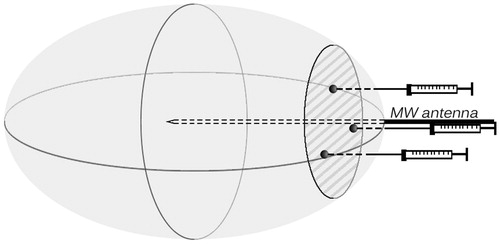
Figure 3. Histological appearance of liver tissues immediately after microwave ablation. (A) The tissue directly adjacent to the needle during microwave ablation. (B) The central zone consists of damaged liver tissue. (C) Normal architecture and inflammatory cells are observed in the transition zone. (d) Normal liver tissue. Magnification ×200.
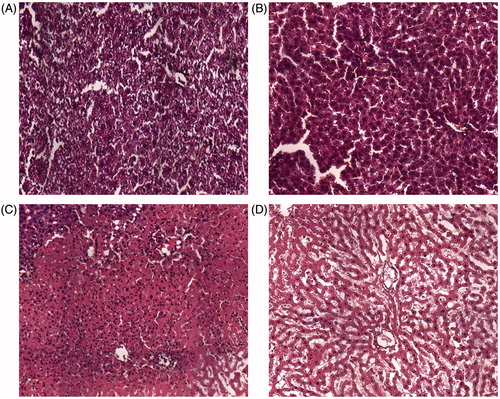
Figure 4. Scanning electron microscopy of liver tissue. Liver specimens were collected immediately after microwave ablation at 25 W for 60 s. (A) Normal liver tissue in an untreated area. (B) Hepatocytes in the transition zone. (C) Liver tissue in the central zone underwent coagulative necrosis, and no intact cells were observed.
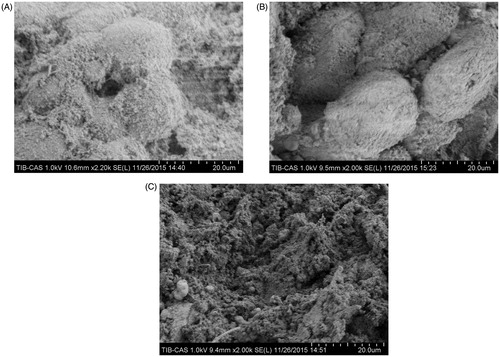
Figure 5. Fluorescence micrographs of GFP expressed in rat liver from PO days 1–7. Liver specimens were obtained separately for frozen section examination and were assessed under a fluorescence microscope. Magnification ×200.
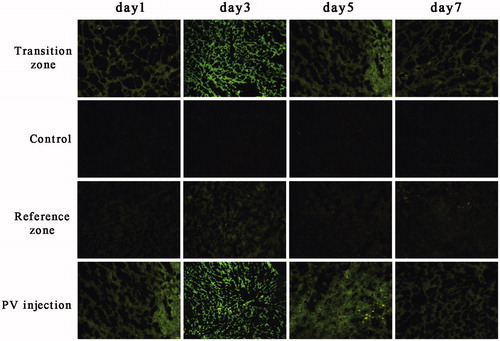
Figure 6. GFP expression after gene transfer. Rat livers underwent microwave ablation followed by immediate gene injection, with fluorescence intensity measured on PO days 1 and 3. Data are expressed as the means ± SDs, and n = 6 for all groups. ***P < 0.001.
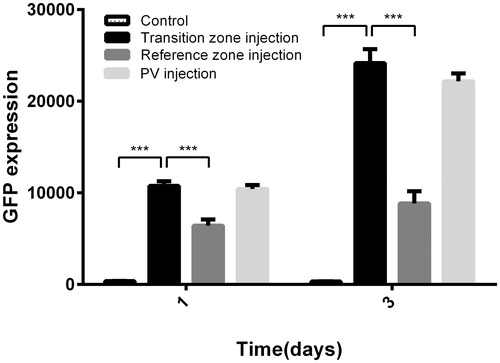
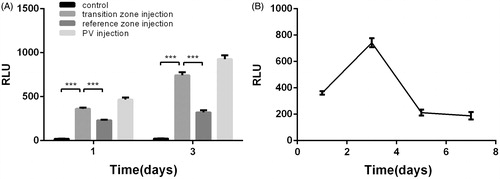
Figure 7. Luciferase activity in all groups at PO days 1 and 3 (A) and the time course after luciferase plasmid transfer in the transition zone (B). Luciferase expression data are expressed as relative light units per mg protein (RLU/mg protein). Data are expressed as the means ± SD, and n = 6 for all groups. ***P < 0.001.