Figures & data
Figure 1. Flow chart indicating study selection procedure for hyperthermia with radiotherapy and/or chemotherapy in cervical cancers for conventional meta-analysis and network meta-analyses.
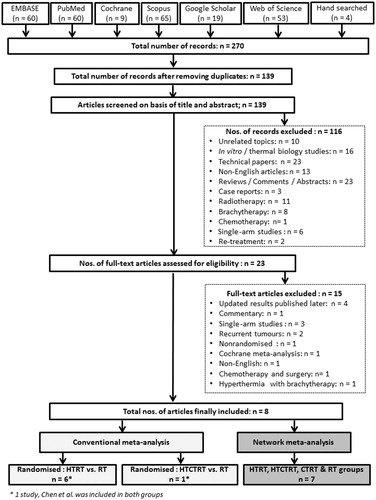
Table 1. Characteristics of the studies included in the present systematic review and meta-analysis pertaining to (a) HTRT vs. RT and (b) HTCTRT vs. RT and (c) HTRT vs. CTRT.
Figure 3. Funnel plots corresponding to the risk difference for (a) complete response; (b) long-term loco-regional control; (c) number of patients alive; (d) acute toxicity; and (e) late toxicity for trials included in thermoradiotherapy (HTRT) vs. radiotherapy (RT). Kendall?s τ and p values for each plot are also shown.
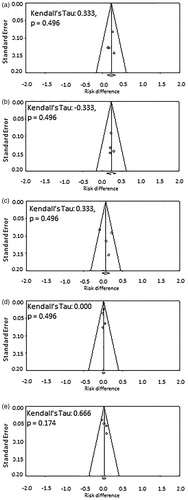
Figure 4. Network meta-analysis for complete response with trials using thermoradiotherapy (HTRT), thermochemoradiotherapy (HTCTRT), chemoradiotherapy (CTRT) and radiotherapy (RT) alone. (a) Network diagram showing the number of trials and patients included in each set of randomised groups; (b) league table with odds ratios and 95% credible interval (95% Cr.I) with pairwise comparison. Random effects model with vague priors has been used for computation of odds ratios.
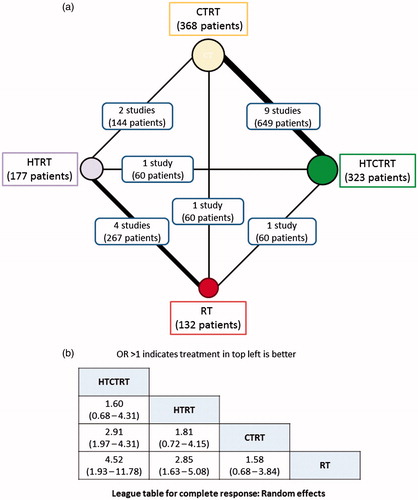
Figure 5. Rankograms for complete response computed using random effects model for subgroups of thermoradiotherapy (HTRT), thermochemoradiotherapy (HTCTRT), chemoradiotherapy (CTRT) and radiotherapy (RT) alone. The rankings have been based on the surface under the cumulative ranking (SUCRA) values with the best rank obtained by the modality with the highest SUCRA value.
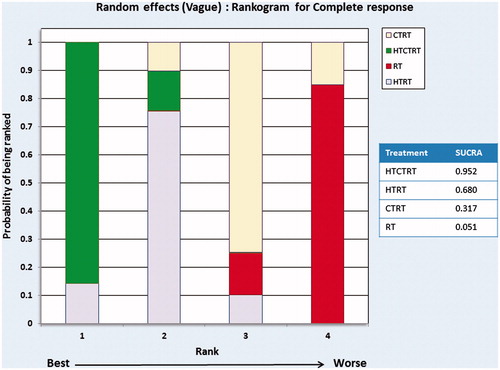
Table 2. Summary of the network meta-analysis characteristics for complete response and patients alive for various treatment arms: thermoradiotherapy (HTRT), thermochemoradiotherapy (HTCTRT), chemoradiotherapy (CTRT) and radiotherapy (RT) alone.
Figure 6. Network meta-analysis for patients alive with trials using thermoradiotherapy (HTRT), thermochemoradiotherapy (HTCTRT), chemoradiotherapy (CTRT) and radiotherapy (RT) alone. (a) Network diagram showing the number of trials and patients included in each set of randomised groups; (b) league table with odds ratios and 95% credible interval (95% Cr.I) with pairwise comparison. Random effects model with vague priors has been used for computation of odds ratios.
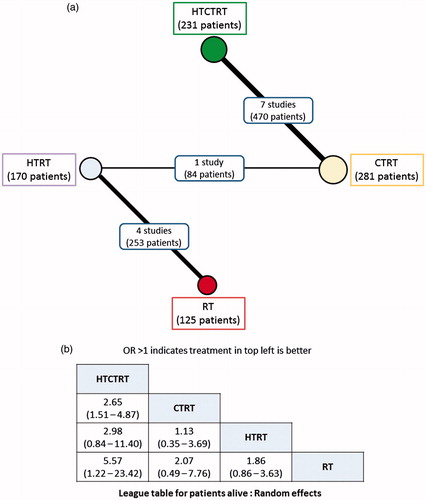
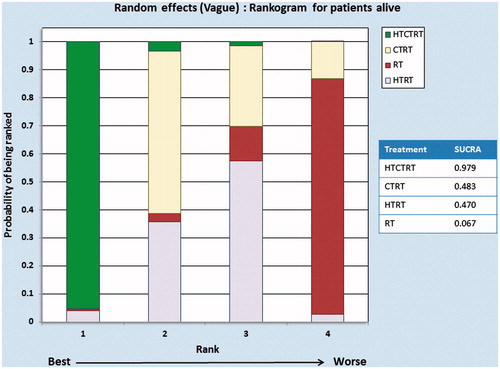
Figure 7. Rankograms for patients alive computed using random effects model for subgroups of thermoradiotherapy (HTRT), thermochemoradiotherapy (HTCTRT), chemoradiotherapy (CTRT) and radiotherapy (RT) alone. The rankings have been based on the surface under the cumulative ranking (SUCRA) values with the best rank obtained by the modality with the highest SUCRA value.