Figures & data
Figure 1. (a) A target device which ensured a standardised positioning of the applicators (‘A’) to the vessel (glass tube, ‘G’), was used for comparability of the experiments. It assisted in cutting the ablations exactly at the largest cross-sectional areas. Two electrodes are situated on each applicator, therefore six electrodes are used simultaneously in this multipolar configuration. (b) Five different applicator-to-vessel geometries (GM =0, 2.5, 5.0, 7.5 and 10) were tested. The coagulation zones were compared to a ‘dry run’ without saline perfusion but with a centrally placed vessel.
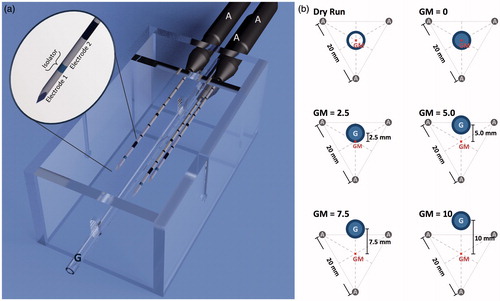
Figure 2. (a) The idealised coagulation zone (4) was averaged out of the six dry runs, which were divided into six equiangular sectors with the vessel as the centre point (1). These sectors were merged with each other along the congruent edges (2). The outer faces were geometrically averaged to a single sector (3), which was fanned out to the idealised coagulation zone (4). (b) An annular segmentation method with the vessel as the centre point was used in order to compare the idealised coagulation zone with the ablations with vascular perfusion. Three areas could be distinguished: (1) intersecting areas between idealised coagulation zone and ablation area, (2) where the idealised ablation area exceeded the ablation area (cooling effects), and (3) where the ablation area exceeded the idealised coagulation zone.
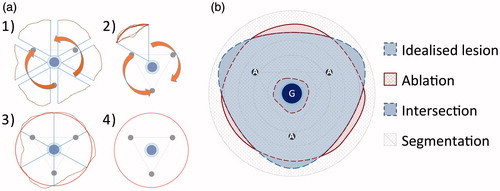
Table 1. Cross sectional areas for all test series. ‘Increase of area’ and ‘cooling effect’ were based on the comparison with the idealised coagulation zone area (958 mm2). The ablation time for the idealised coagulation zone was 25:44 (24:32–28:01).
Figure 3. (a) Exemplary cross sectional areas for each test series (A: applicator, G: vessel). (b) Averaged masks of all test series: The idealised coagulation zone (vertically hatched) was situated behind the actual coagulation zone masks, whereas the actual coagulation zone mask was horizontally shaded and the intersecting area between both coagulation zones was crosswise hatched. The dry run showed a round and homogenous ablation area, which reached the vessel (G) directly, whereas all other test series with perfusion showed a cooling effect around the vessel. The coagulation zone appears annular (GM = 0, GM = 2.5) respectively c-shaped (GM = 5.0, GM = 7.5, GM = 10.0) in dependence of the applicator-to-vessel geometry.
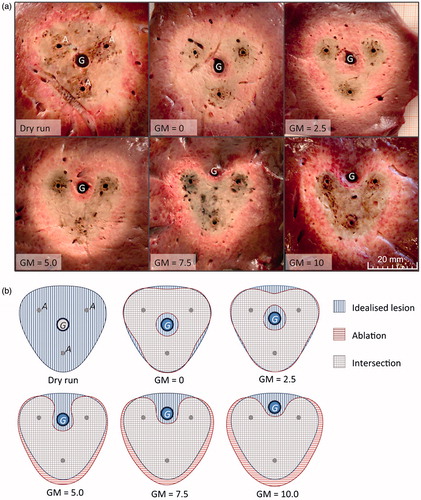
Figure 4. A similar cooling effect (fringe of native liver tissue surrounding the vessel) could be seen in all test series within a distance of 5 mm to the vessel (GM =0: 42%, GM =10: 57%) independent of the applicator-to-vessel geometry. A growth in coagulation zone area compared to the idealised coagulation zone is plotted negatively in the chart. Only for the most eccentrically placed vessel (GM =10) a significant (**) growth in coagulation zone area (25%) could be observed compared to the idealised coagulation zone. (p < 0.05; error bar: min–max; G = vessel; d = 5 mm).
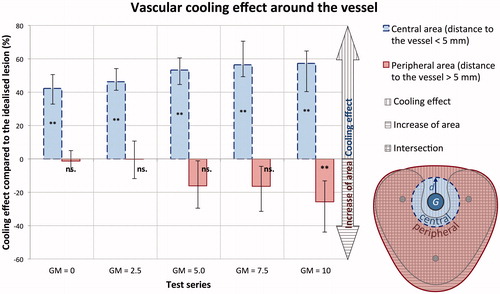
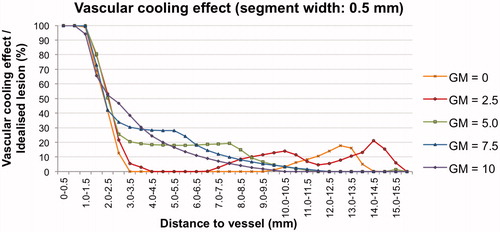
Figure 5. Vascular cooling effect in comparison to the idealised coagulation zone. A similar cooling effect was observed for all five test series up to a distance of 2.5 mm from the vessel. Differences between the test series were observed beginning from a distance of 2.5 mm to the vessel. This effect was most likely to be explained by the macroscopic findings of the coagulation zones. Test series with centrally placed vessels (GM = 0, GM = 2.5) showed an annular shape with a small fringe of native tissue (cooling effect) at the coagulation zone borders. Whereas test series with eccentrically placed vessels (GM = 5.0, GM = 7.5 and GM = 10) occurred as c-shaped, resulting in a slowly decreasing cooling effect depending on the distance from the vessel.