
Figures & data
Figure 1. Flowchart summarising the steps of the study.
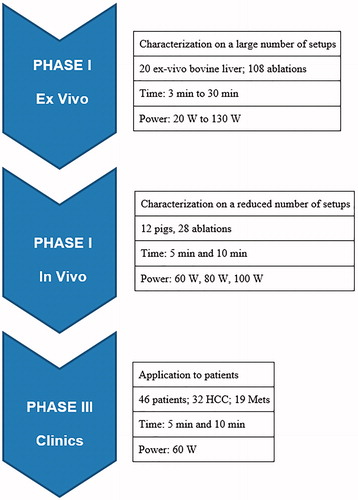
Table 1. Microwave ablation zone sizes in ex vivo bovine liver for different combinations of treatment power and duration.
Figure 2. Ex vivo ablation diameter (upper graph) and sphericity (lower graph) for different power settings and ablation times. The lines in Figure 2a represent the best cubic root fit of the data. The lines in Figure 2b are guides for the eye.
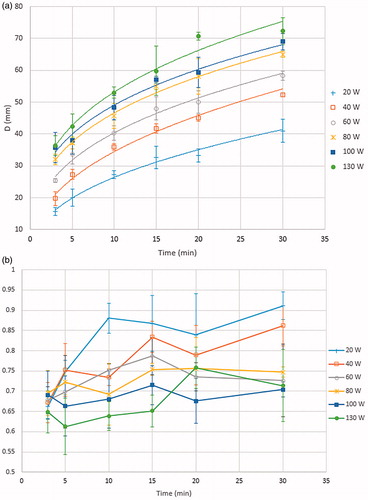
Figure 3. Ex vivo ablation volume as a function of the deposited energy. The black line is the best linear fit.
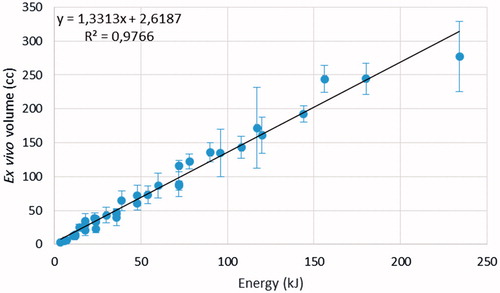
Figure 4. Ablation diameters (upper graph) and sphericity (lower graph) following treatments at 60 W for either 5 or 10 min in liver metastases, ex vivo bovine liver, hepatocellular carcinomas and in vivo porcine liver.
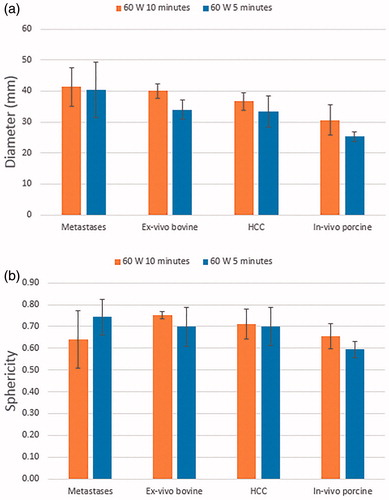
Figure 5. Graphical comparison of the average ablation zones (sectioned along the applicator shaft) obtained upon treatments performed at 60 W for either 5 min (left) or 10 min (right) in HCC, liver metastases, in vivo porcine liver and ex vivo bovine liver.
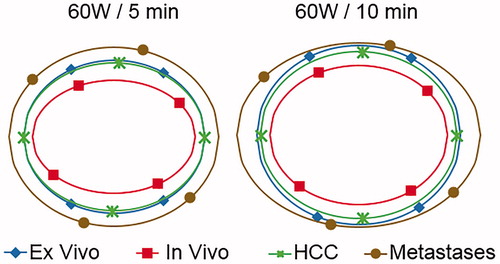
Table 2. Microwave ablation zone sizes for different treatment power and time settings in in vivo porcine liver.
Table 3. Average microwave ablation zone sizes in patients with HCC or liver metastases treated at 60 W for either 5 or 10 min.
Table 4. Percentage variations of the ablation volume V, sphericity S, diameter D and length L of the three in vivo (IN) experiments compared to ex vivo (EX) results. Each percentage variation was calculated as 100×(IN-EX)/EX. Below each percentage variation the corresponding p-value is reported to assess the significance of the variation.