Figures & data
Table 1. Mean final diameters (Dx, Dy) for the three different MR sequences ± SD.
Figure 1. Ablation zone signal changes after 0, 1, 3, 5, 7 and 10 min on each sequence with clear visibility of the MW antenna and interference-induced noise artefacts increasing with ablation time. The ablation area appears as a summation of branching signal loss lines steadily increasing perpendicular to the needle surrounded by a diffuse halo with a thickness of a few millimetres. (a) FLASH sequence: the halo was usually indistinguishable from the mostly diffuse ablation-related signal loss. This sequence was slightly more prone to needle-related artefacts and showed a high inhomogeneity of appearance between examinations. (b) VIBE sequence: in the first 5 min, a relatively sharp outer delineation of the ablation area is visible, but in the later phases it gets more diffuse, being indistinguishable from the halo. In some cases the central signal loss was almost non-apparent, the ablation area being suggested only by the extended halo. (c) starVIBE sequence: the appearance of the ablation area is similar to similar to that of VIBE, especially in the first 5 min, but the presence of the halo makes a precise delimitation of the ablation zone more difficult, especially in the later phases of ablation. Almost no needle artefacts and generally higher noise were noticeable on this sequence.
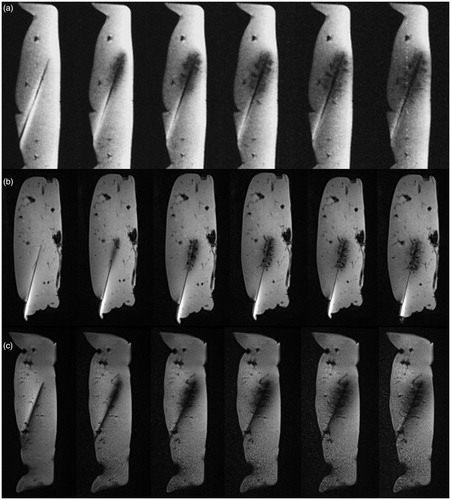
Figure 2. Correlation of Dx and Dy as measured on each MR sequence and corresponding diameters as measured on gross pathology.
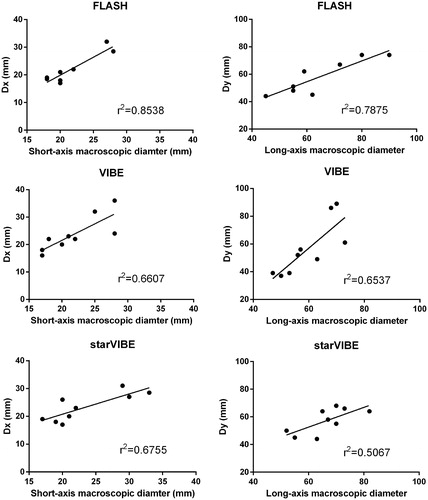
Table 2. Macroscopic characteristics ± SD of the ablation zone for the different time periods and antenna sizes.
Figure 3. The growth pattern of the short-axis diameters as depicted on the MR sequences with the corresponding macroscopic values as comparison. The final short diameter (Dx) in each sequence is always slightly overestimated compared to the macroscopic diameter. Only two experiments involving the 15-min FLASH (14 gauge), could be evaluated because almost no ablation-related changes could be noticed in one case.
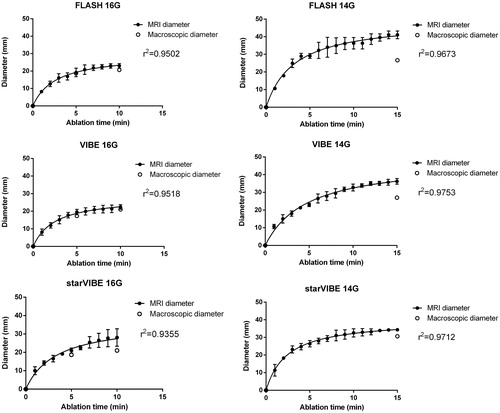
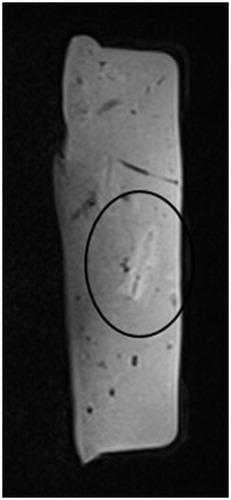
Figure 4. Image acquired 15 min after ablation (VIBE, 16 gauge). After tissue cooling, the area around the applicator appears slightly hyperintense.