Figures & data
Figure 1. Floating sleeve dipole (FSD) antenna used in computational and experimental studies of MWA. The length dimensions are customised for seven different frequencies between 1.9 and 26 GHz. (a) Longitudinal cross-section. (b) Transverse cross-section.
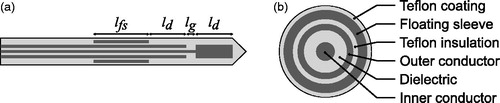
Table 1. Dimensions of FSD antennas.
Figure 2. Simulated SAR patterns for seven FSD antennas with 2.2-mm coaxial diameters. Each contour encloses the volume within which 75% of power radiated by the respective antenna is absorbed.
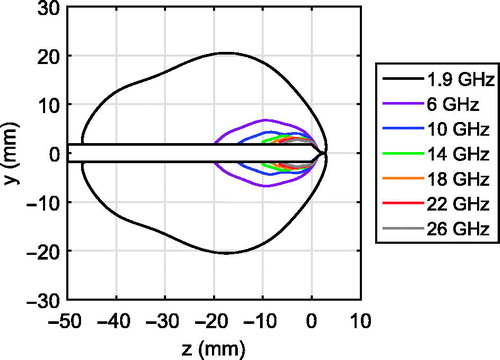
Figure 3. Thermal simulation results for FSD antennas operating in (a) in vivo porcine muscle tissue, (b) ex vivo porcine muscle tissue with an initial temperature of 20 °C, and an ambient temperature of 20 °C, and (c) in vivo porcine muscle with higher perfusion and metabolic heat generation rates. The antenna is shown in white with a black outline, and the floating sleeve is highlighted in black for reference.
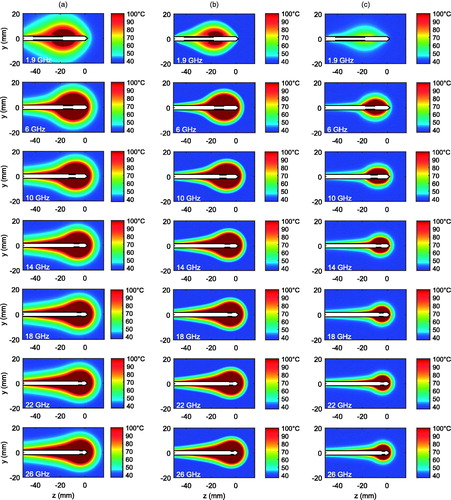
Figure 4. (a) Diagram illustrating the lateral radius, ra, and the longitudinal radius, rb, of the ablation zone, defined in simulation as the volume enclosed by the 50 °C contour. (b) Simulated in vivo ablation zone dimensions for porcine muscle with typical (solid lines) and high (dashed lines) assumed values of perfusion and metabolic heat generation, along with the ratios of their longitudinal and lateral radii, as a function of frequency. (c) Simulated ex vivo ablation zone dimensions and aspect ratios with an ambient temperature of 20 °C (solid lines) and 37 °C (dashed lines). (d) Average dimensions of ablation zones with min/max error bars, along with average aspect ratios from ex vivo ablation experiments.
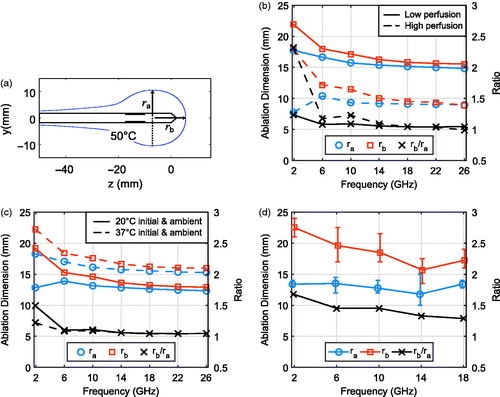
Figure 5. Photographs of representative ablation zones at (a) 1.9 GHz, (b) 10 GHz, (c) 18 GHz.
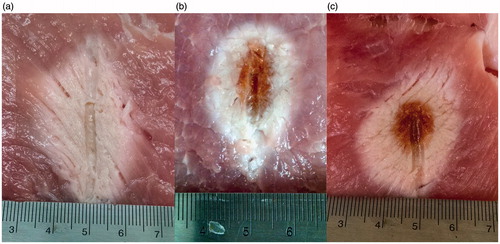
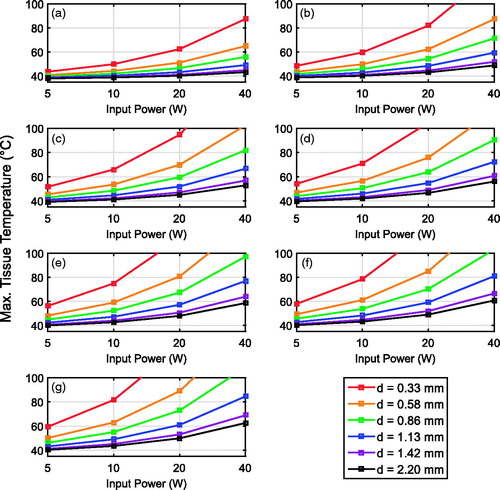
Figure 6. Simulated peak temperature in in vivo porcine muscle tissue (assuming a typical low perfusion rate associated with muscle) at the surface of an insulated coaxial cable as a function of input power, cable diameter, and operating frequency. (a) 1.9 GHz, (b) 6 GHz, (c) 10 GHz, (d) 14 GHz, (e) 18 GHz, (f) 22 GHz, and (g) 26 GHz.