Figures & data
Table 1. Summary of current literature on treatment of liver malignancies using microwave ablation systems.
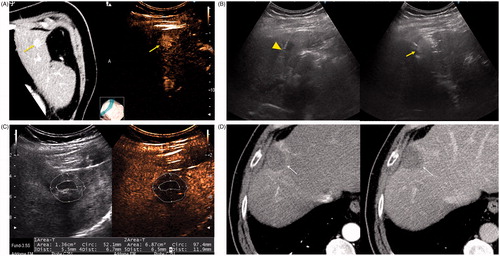
Figure 1. An 84-year-old woman with a history of cirrhosis and hepatitis C. (A) Contrast-enhanced computed tomography (CECT) image demonstrates an arterial-enhanced lesion in segment IV measuring 4.0 cm (arrow). (B) Lesion was treated with the placement of a single cooled microwave antenna at 40 W for 15 min. (C) A 24-h post-procedural CECT demonstrates the presence of a thick hypervascular peri-ablation halo (triangles). This finding can be seen from the hyperemic reaction that regularly develops around an ablation zone. (D) Four-year follow-up of an arterial-phase (left) and portal-venous phase (right) CECT demonstrates contraction of the ablation zone (arrow) with no evidence of enhancement.
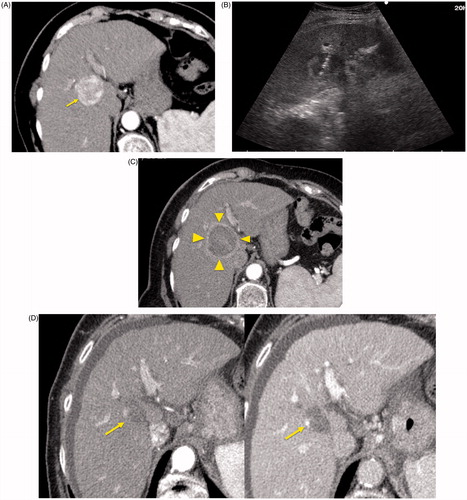
Figure 2. A 67-year-old woman with liver metastasis from colorectal cancer. (A) Pre-ablation MRI (left) of liver lesion (arrow) and CEUS (right) confirming presence of 13 × 14 mm liver lesion (arrow). (B) The lesion was treated with a single water-cooled antenna at 50 W for 6 min (left). Post-ablation image demonstrating hyper-echoic region measuring 34 × 37 mm, representing the ablation zone (right). The goal is to create ablation margins >1 cm beyond tumour boundary. (C) Post-ablation B-mode ultrasound (left) and CEUS (right) showing the ablation zone (anechoic) with the presence of the hypervascular peri-lesional halo. (D) CECT (left) and CEUS (right) demonstrating ablation zones that encompass the entire lesion measuring 32 × 42 mm.
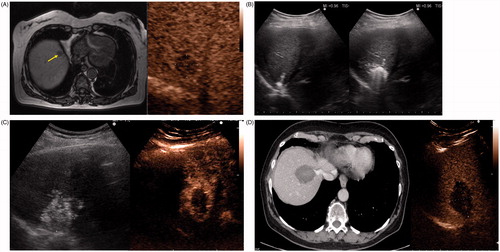
Figure 3. A 79-year-old man with a history of cirrhosis and hepatitis C and prior treatment with surgery and radiofrequency ablation for HCC. (A) CECT (left) and CEUS (right) images demonstrating an arterially enhanced liver lesion (yellow arrows). (B) Ultrasound image showing single gas cooled-antenna (arrowhead) being guided into the HCC (left) and after being treated at 50 W for 5 min (right). This ultrasound image shows progression of treatment via rapid generation of gas inside the liver tissue (arrow). (C) On post-procedural B-mode (left) and CEUS (right) (24 h post-ablation), the image shows presence of a central hypo-echoic area corresponding to the lesion treated, surrounded by a hyper-echoic area which corresponds to the inflammatory region of the ablation zone. (D) A 24-h post-ablation arterial phase CECT (left) and portal-venous phase CECT (right) showing the ablation zone encompassing the lesion (arrows).