
Figures & data
Table 1. Patient demographics.
Table 2. Tumour characteristics/adjuvant profile among groups.
Table 3. Operative parameters and outcomes among groups.
Table 4. Factors affecting complications.
Figure 1. Kaplan–Meier survival curve: comparing overall survival between the three groups. Note: CRA: combined microwave ablation and resection; MWA: microwave ablation.
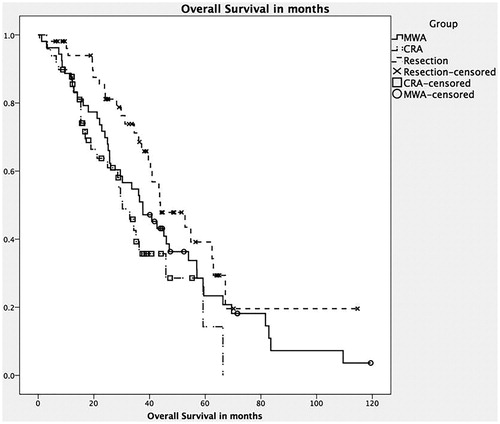
Figure 2. Kaplan–Meier survival curve: comparing disease-free survival between the three groups. Note: CRA: combined microwave ablation and resection; MWA: microwave ablation.
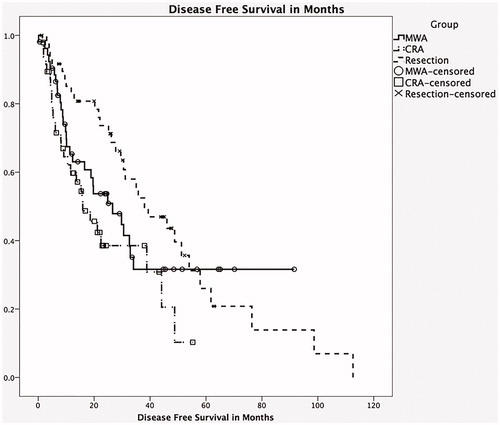
Table 5. Operative parameters and outcomes, MCRC only.