
Figures & data
Figure 1. Examinations of a patient with fibroids before and after ablation. (A) MRI (T2WI) before ablation showed the fibroid. (B) Before ablation, the contrast-enhanced ultrasonography (CEUS) image showed non-homogeneous enhancement within the fibroid. (C) During ablation, tissue effects of ablation. (D) After ablation, no contrast enhancement was observed in the ablation area. (E) Contrast-enhanced MRI 3 days after ablation showed the ablation zone.
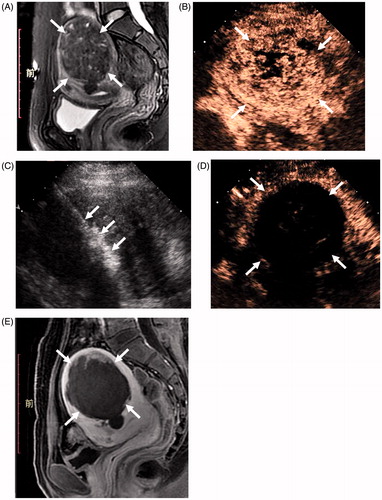
Table 1. Fibroid volumes, haemoglobin levels and uterine fibroid symptom and health-related quality of life questionnaire (UFS-QOL) scores before and after ablation.