
Figures & data
Table 1. Patient characteristics.
Figure 1. CONSORT flow diagram for 101 randomised patients with locally advanced cervical cancer.
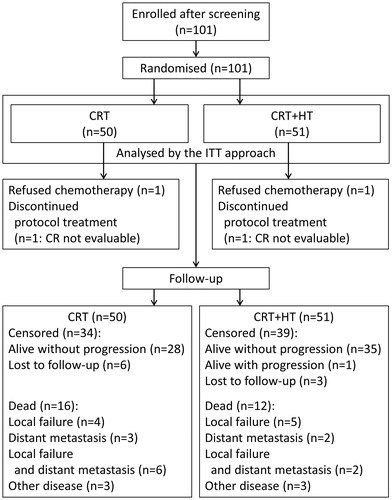
Figure 2. Overall survival for patients treated with chemoradiotherapy or chemoradiotherapy plus hyperthermia.
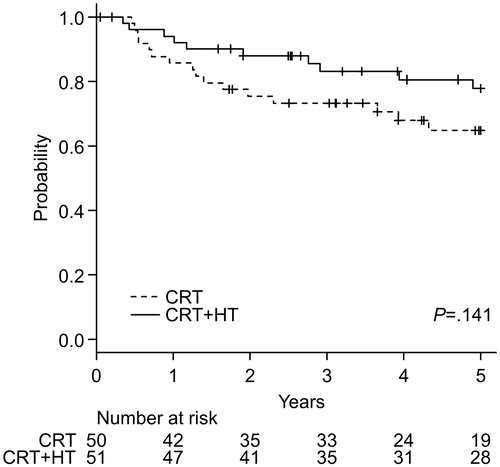
Figure 3. Disease-free survival for patients treated with chemoradiotherapy or chemoradiotherapy plus hyperthermia.
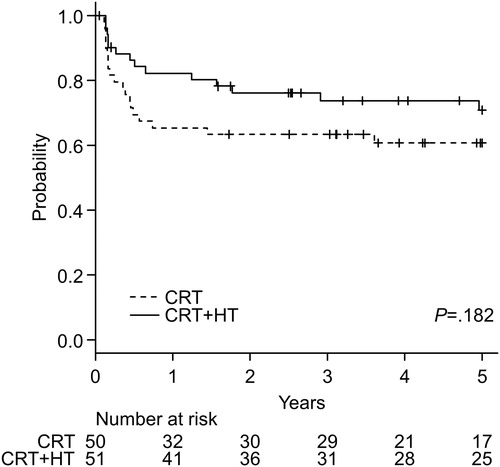
Figure 4. Local relapse-free survival for patients treated with chemoradiotherapy or chemoradiotherapy plus hyperthermia.
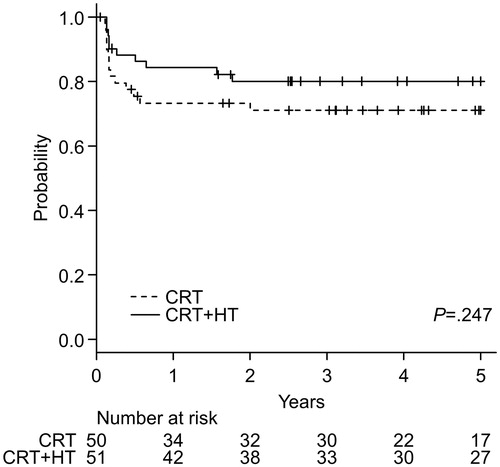
Figure 5. Result of logistic regression analysis to predict complete response (adjusted for age, stage and histology).
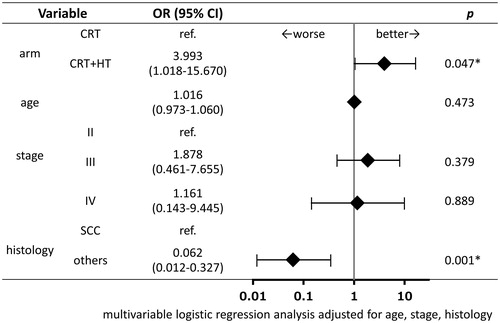
Table 2. Acute-phase adverse events.
Table 3. Late-phase adverse events.