Figures & data
Figure 1. Creation of large coagulation zones using monopolar thermal coagulation could minimise intraoperative blood loss throughout different stages of liver resection: initial coagulation of the vessels located in zone to be transected (A), coagulation of vessels on the margin of resection during the transection (B), and preventive coagulation of the remaining resection surface (C).
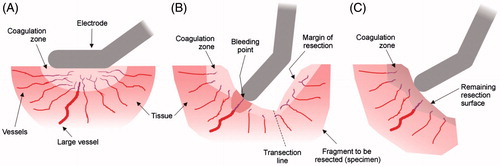
Figure 2. CONSORT (Consolidated Standards of Reporting Trials) diagram for this study.
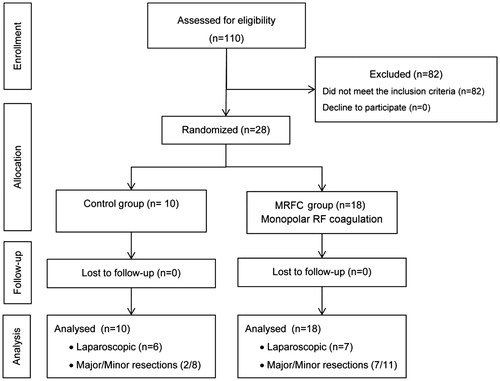
Table 1. Demographic and clinical characteristics of the patients involved in the study.
Figure 3. Box plots depicting blood loss during the transection (A) and blood loss per transection area (B) for control and monopolar RF coagulation (MRFC) groups. The boxes represent the interquartile range which contains 50% of the values. The whiskers are lines that extend from the box to the highest and lowest values, excluding outliers. The line across the box indicates the median. Both outcomes were statistically significant (*p < .05).
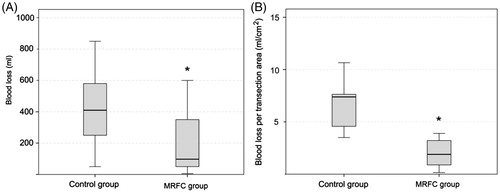
Table 2. Mortality and morbidity in patients included in the study.
Table 3. Clinical details of the patients which required blood transfusion after surgical resection.
Table 4. Biochemical levels of ferritin, iron and transferrin in urine previously and after the surgical transection.
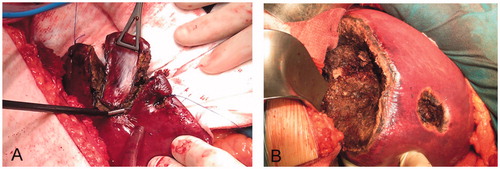
Figure 4. Examples of RF-induced large coagulation zones in the monopolar RF coagulation (MRFC) group. (A) Limited resection in which the monopolar electrode with built-in blade was used as sole sealing and dissecting device. (B) Segmentectomy of segments 5–8, 4a, and two limited resections. Note the thickness of the coagulation zones created on the resection surfaces, which were possibly responsible for the minimal intraoperative bleeding in the MRFC group.