Figures & data
Figure 1. Schematic diagram of tumour locations at the inferior margin of the liver including portions of segments 2, 3, 4 on the left, segments S5 and S6 on the right, where the thickness of liver is less than 5 cm. For tumours in this location, the distance between the tumour and hepatic surface is less than 5 mm.
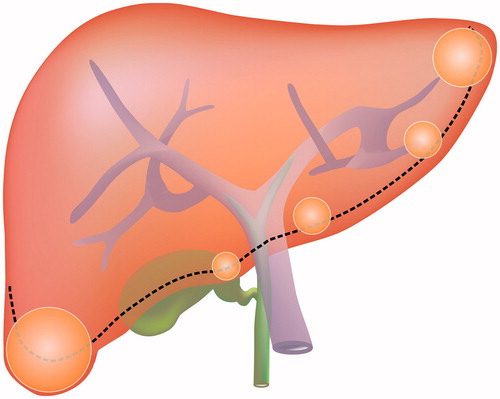
Table 1. Patient characteristics (n = 77).
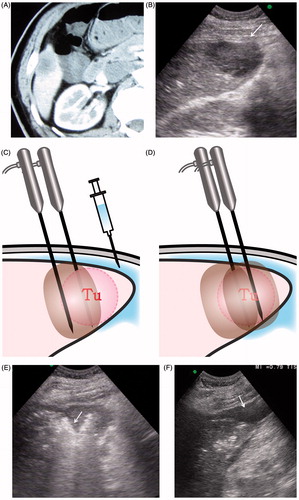
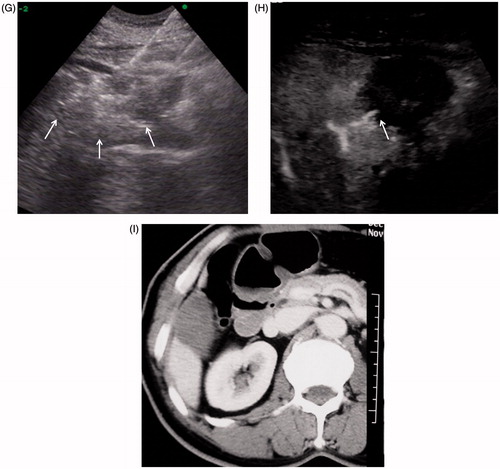
Figure 3. A 77-year old man with liver metastasis of colon cancer received percutaneous conventional tumour RFA. Local tumour progression occurred one year after tumour ablation. (A) Arterial phase in enhanced CT before RFA: the hypo-enhanced metastasis tumour was located the inferior margin of Segment 6. (B) The tumour was directly coagulated by simultaneous RF application with three electrodes. (C) Enhanced CT one month after RFA showed no tumour residue was found in the coagulated area. (D) Enhanced MRI (T1WI in arterial phase) one year after treatment showed tumour local progression at the inferior of coagulated area (arrow).
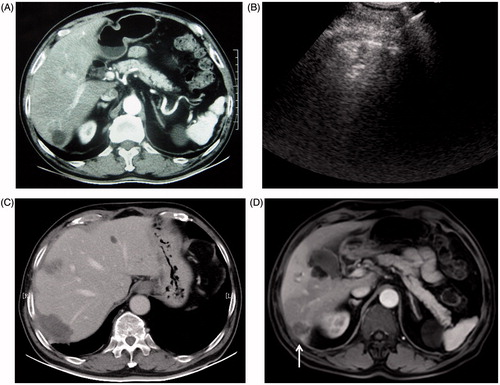
Table 2. Comparison of clinical outcomes after RFA.
Figure 4. Overall survival of hepatic wedge ablation (HWA) group and conventional tumour ablation (CTA) group for HCC. The one, two and three-year overall survival in HWA group and CTA group was 100.0%, 92.3%, 76.9% and 85.4%, 80.4%, 80.4%, respectively (p = .942).
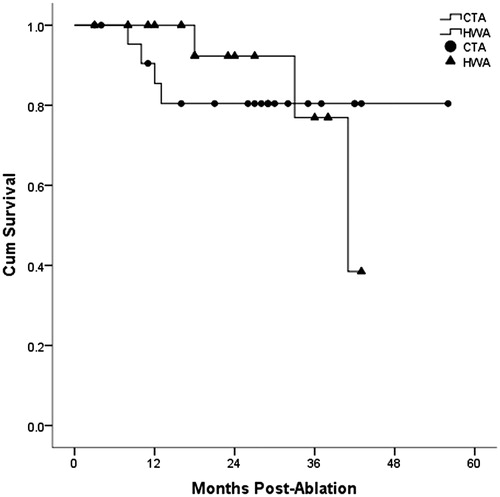
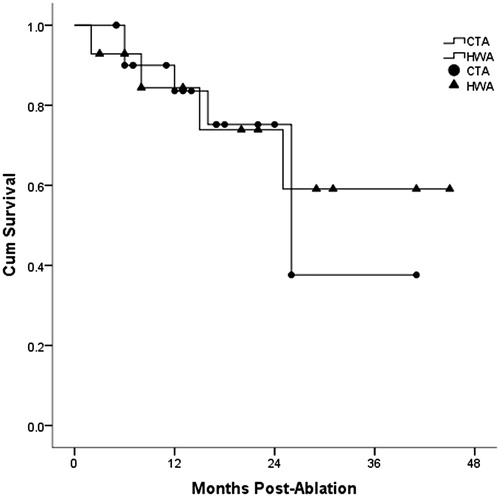
Figure 5. Overall survival of hepatic wedge ablation (HWA) group and conventional tumour ablation (CTA) group for liver metastases. The one, two and three-year overall survival in HWA group and CTA group was 84.4%, 73.9%, 59.1% and 83.6%, 75.2%, 37.6%, respectively (p = .811).