
Figures & data
Figure 1. Schematic diagram for the study design.
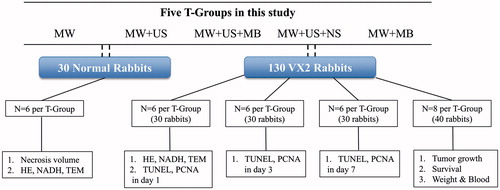
Figure 2. Evaluation of the effectiveness of MBs in combination with US for MW ablation (25 W, 1 min). (A) Temperature variances of normal rabbit livers (left) and VX2 rabbit tumours (right) during ablation among the T-Groups (n = 6). (B) Necrosis volume of the ablated tissues in rabbit livers among the T-Groups (p < .001 vs. MW + US T-Group; ***p < .001 vs. MW + MB T-Group; ****p < .0001 vs. every T-Group; #p > .05 vs. MW + US T-Group; ^p > .05 vs. MW T-Group; n = 6). (C) Digital photographs of the ablated liver tissues in normal rabbits in all T-Groups. The tissue carbonisation surrounding the antenna is shown in the ablative centre (arrow).
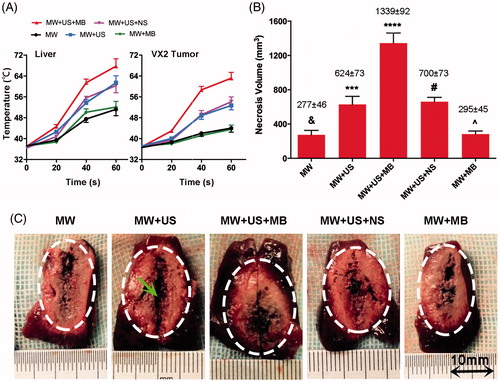
Table 1. The temperature variances during ablation among T-Groups on normal rabbits (°C).
Table 2. The temperature variances during ablation among T-Groups on VX2 rabbits (°C).
Figure 3. Microscopy images of selected tissue specimens in normal rabbit livers. (A) HE-stained images under the same magnification time (400 ×). Scale bar: 25 μm. (B) NADH-stained images under the same magnification time (40 ×). Scale bar: 250 μm. B1, B5, normal liver tissues are stained (black arrows). B3, non-staining is shown in the ablated zone (black arrow). B2, B4, black arrows represent the boundaries of necrosis (black arrows). (C) TEM images of the same magnification time (15 000 ×). Scale bar: 1.5 μm. C1, C5, integrated nuclear membrane and intact mitochondria (black arrows). C2, C4, swollen mitochondria and vacuolar degeneration (black arrows). C3, remnants of nuclear fragments and disappeared organelles (black arrows).
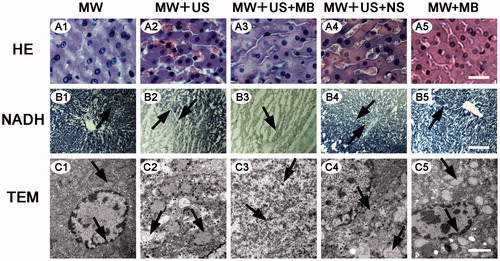
Figure 4. Microscopy images of selected tumour specimens in VX2 rabbit livers. (A) HE-stained images under the same magnification time (400 ×). Scale bar: 25 μm. A1, A5, mitosis of normal tumour nucleus (black arrows); A2, fragments of tumour nucleus (black arrow); A3, a mass of amorphous substance stained red homogeneously (black arrow); A4, interstitial hyperaemia and oedema (black arrow). (B) NADH-stained images of the same magnification time (400 ×). Scale bar: 25 μm. B1, normal tumour cells are stained (black arrow); B2, B4, sharp demarcations between the necrotic and non-necrotic regions (black arrows); B3, no staining in the ablated zone (black arrow). (C) TEM images. Scale bar: 5 μm. C1, C5, the integrated nuclear membrane (black arrows); C2, C4, obviously interrupted nuclear membrane (black arrows); C3, the cellular fragments in all around (black arrow).
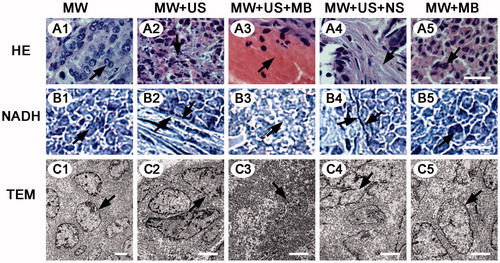
Figure 5. Immunohistochemical examination showing the enhanced cell death of residuals in the presence of MBs in combination with US after ablation. (A) TUNEL assay images of each T-Group in 1 d, 3 d and 7 d after ablation. Arrow (green) in the first line indicates a TUNEL negative cell, and arrow (yellow) in the third line indicates a TUNEL positive cell. (B) AI of each T-Group at different days after ablation (*p < .05, vs. the other T-Groups on the same day. #p > .05 vs. the other T-Groups in the same day. (C) PI of each T-Group at different days after ablation (*p < .05 vs. the other T-Groups on the same day. #p > .05 vs. the other T-Groups on the same day. (D) PCNA assay images of each T-Group 1 d, 3 d and 7 d after ablation. Arrow (yellow) in the first line indicates a PCNA positive cell, and arrow (green) in the third line indicates a PCNA negative cell. Magnification, 400×; scale bar, 25 μm.
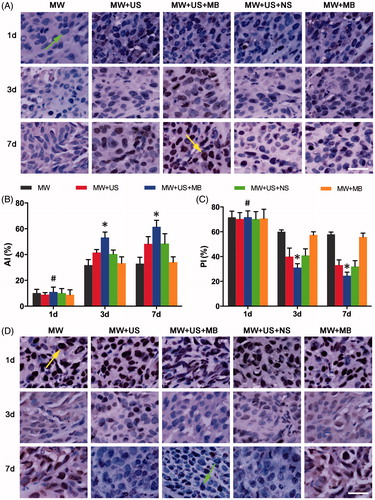
Table 3. The apoptotic index (AI) and proliferative index (PI) of residual tissue tumour cells in every T-Group.
Figure 6. Growth inhibition of residual tumours and survival analysis in VX2 rabbits. (A) Ultrasonography of liver tumours in different T-Groups before and after ablation 3 d, 6 d and 9 d. Scale bar: 10 mm. (B) Tumour volume in each T-Group after ablation 3 d, 6 d and 9 d (#p > .05 vs. other T-Groups at day 0; &p > .05 vs. MW + US and MW + US + NS T-Groups at day 3; ^p < .01 vs. MW and MW + MB T-Groups at day 3; *p < .001 vs. other T-Groups at days 6 and 9, respectively; n = 8). (E) Cumulative survival of VX2 rabbits in different T-Groups after ablation (n = 8).
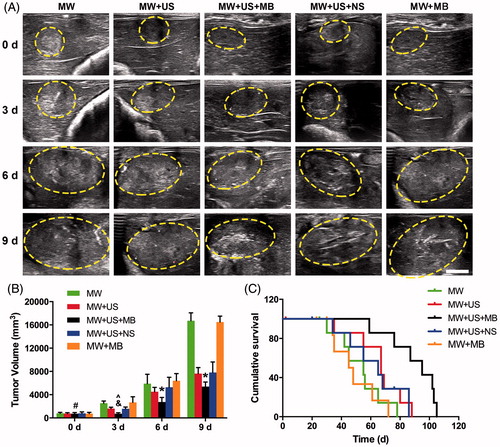
Table 4. The tumour volume (mm3) of VX2 rabbits during the follow-up post ablation.
Table 5. The results of the weight and the blood assay of VX2 rabbits before and after MW ablation.