
Figures & data
Figure 1. STAR cells in culture – morphology. Micrograph shows the diversity of STAR cells, with a somewhat cuboidal appearance of lung epithelium but with frequent large gaps between cells and clusters (square to the left) and lengthy dendritic-like connections to neighboring cells (rectangle to the upper right). The circle denotes a large cuboidal cell with numerous vacuolar intracellular structures, and ovals point out (viable) floating cells.
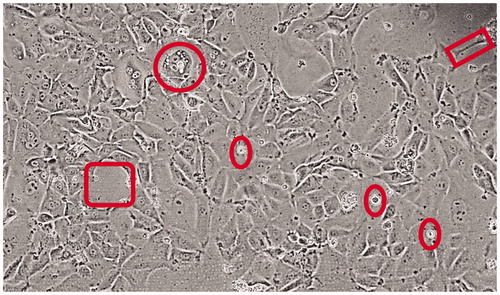
Figure 2. Chaperone and UPR and related signaling molecule expression in canine lung and tumors. Western blots of normal canine lung lysate (“Lung”) STAR metastatic/recurrent (“Met”) and original primary (“Primary”) tumor lysates were probed for the ER chaperones (left panel) listed, for the (typically) cytosolic chaperones (middle panel) listed, and for proteins involved in the UPR and downstream signaling (right panel). Anti-TUBB (beta tubulin) staining is used as an internal loading control.
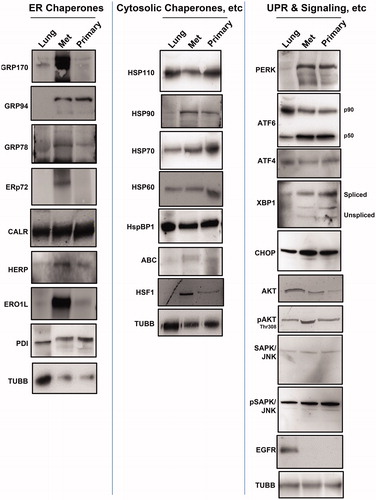
Figure 3. Heat shock and induction of the unfolded protein response (UPR) in STAR cell line. A cell line was derived from the metastatic lung tumor, which was subjected to heat shock (42 °C, 2 h) or 1 mM DTT, 4 h (to induce the UPR). Cells recovered for 24 h, and were lysed. Western blots were performed to compare protein levels in untreated (“Control”) cell lysates vs. treated (“Heat Shock”) (“UPR”) cell lysates. Left panel shows heat shock protein responses; middle panel shows ER chaperone protein responses; right panel shows UPR components. Actin probe was used as an internal loading control.
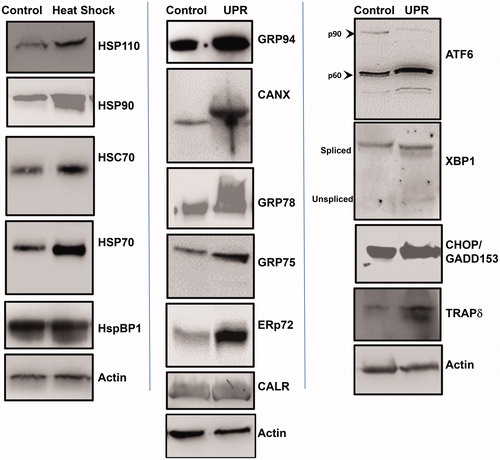
Figure 4. Altered signaling profiles in STAR cells pre-treated with stress, followed by HSP90 inhibitors. STAR cells were kept at typical culture conditions (“Standard Conditions”, 37 °C, 5% CO2), or were heat shocked (“Heat Shock”, 42 °C, 2 h), or were subjected to UPR induction (“UPR”, 1 mM DTT, 4 h). Cells recovered for 24 h, and were then treated with 5 nM HSP90 inhibitors for 8 h. Cells were then lysed, and lysates exposed to an intracellular signaling array (antibodies that recognize phosphorylation of specific proteins, or cleavage products). Spot intensities were quantified and compared to controls for each condition (control values set = 1).
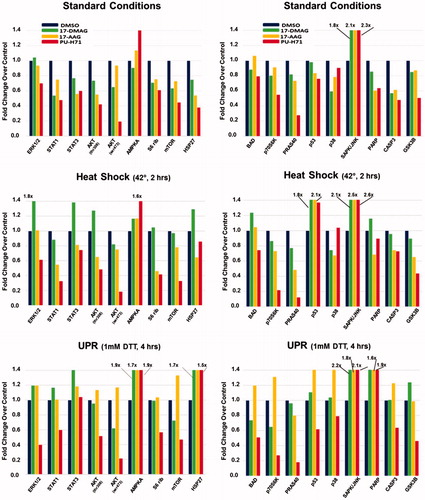
Figure 5. Soft-agar growth of STAR cells pre-treated with stresses, and then treated with an HSP90 inhibitor. STAR cells were first either left under typical culture conditions, heat shocked or had the UPR induced (described above). After 24 h recovery, cells were treated in culture for 24 h with the HSP90 inhibitor PU-H71 (5 nM), and were then plated in a soft-agar growth assay. Some cells received no drug (“Untreated”), some received no further drug treatment (“PU-H71 24 h”), and some cells received continuous daily dosing with 5 nM PU-H71 (“PU-H71 cont”) for the remainder of the culture growth. After eight days in soft agar, the matrix was solubilized and growth was measured by MTT assay.
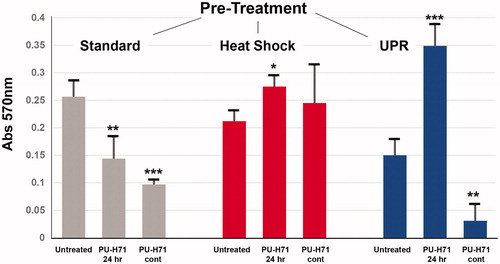
Figure 6. STAR cell outputs of proteins involved in apoptosis after stress and/or HSP90 inhibitor treatment. STAR cells were kept in standard culture conditions (“Control”), were subjected to the UPR (“UPR”), were left unstressed but treated with 5 nM PU-H71 for 24 h (“PU-H71”, or had the UPR induced, and after 24 h recovery, were treated with 5 nM PU-H71 for 24 h (“UPR + PU-H71”). Cells were lysed, and then applied to an antibody array measuring quantities of proteins listed. Spots were quantified and normalized to control values as in . Shown is a heat map representation of those data with the scoring scale at the bottom.
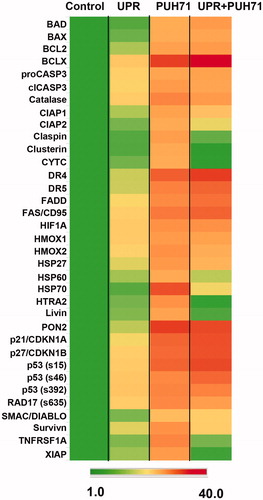
Figure 7. Ingenuity Pathway Analysis (IPA) comparisons of the quantified readouts from . Values were converted to log2 ratios of experimental/control and entered into a Comparison Analysis in IPA. The top 2 networks (interactomes) are shown. Network names are also shown. Proteins with elevated values from the array are depicted in large bold font with dark background. For B, signaling proteins with known involvement in the UPR are highlighted in lighter background. The “scores” listed are − log [p values] and are based on the probabilities of random associations of these genes/proteins. The significance threshold is set at by default as 1.25. “Focus molecules” refer to nodes from which networks initiate. Solid dark lines show direct connections between proteins found in the array; these are well-known or literature-documented interactions. Broken lines represent indirect connections arising from speculation, or via known intermediaries. Light colored lines connect identified proteins within the network with other proteins which were not part of the array. Line lengths (“edges”) between the protein “nodes” correlate to the amount of supportive literature documenting those interactions. Please note, we have shortened numerous edges to fit the interactomes into the figure.
![Figure 7. Ingenuity Pathway Analysis (IPA) comparisons of the quantified readouts from Figure 6. Values were converted to log2 ratios of experimental/control and entered into a Comparison Analysis in IPA. The top 2 networks (interactomes) are shown. Network names are also shown. Proteins with elevated values from the array are depicted in large bold font with dark background. For B, signaling proteins with known involvement in the UPR are highlighted in lighter background. The “scores” listed are − log [p values] and are based on the probabilities of random associations of these genes/proteins. The significance threshold is set at by default as 1.25. “Focus molecules” refer to nodes from which networks initiate. Solid dark lines show direct connections between proteins found in the array; these are well-known or literature-documented interactions. Broken lines represent indirect connections arising from speculation, or via known intermediaries. Light colored lines connect identified proteins within the network with other proteins which were not part of the array. Line lengths (“edges”) between the protein “nodes” correlate to the amount of supportive literature documenting those interactions. Please note, we have shortened numerous edges to fit the interactomes into the figure.](/cms/asset/1751cbf5-07c6-4a36-aa94-3f3778190895/ihyt_a_1256503_f0007_c.jpg)