Figures & data
Table 1. Pathologic characteristic of tumour lesions and ablation procedure.
Figure 1. The changes of renal function varied in patients of different CKD stages. (A) The serum creatinine concentration pre-MWA, one day after MWA and at the final follow-up; (B) The serum urea nitrogen concentration pre-MWA, one day after MWA and at the final follow-up.
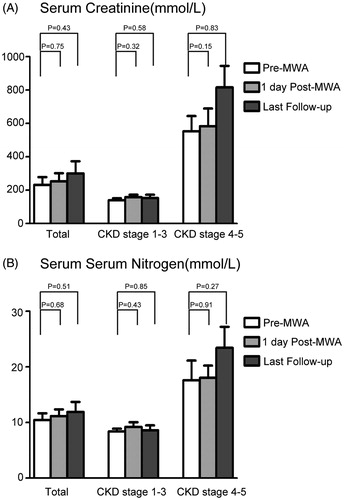
Figure 2. A 3.3 × 3.0 cm tumour in the solitary kidney of a 48-year-old woman treated with MWA. (A) Preablation enhanced-CT image shows the lesion adjacent to the renal pelvis (white arrow); (B) CEUS displays a heterogeneous hyperenhancement neoplasm (white arrow); (C) CEUS shows no hyperenhancement in the ablation zone (grey arrow) three days after MWA; (D) After MWA, a MR Image shows no residual tumour in the ablation zone (grey arrow).
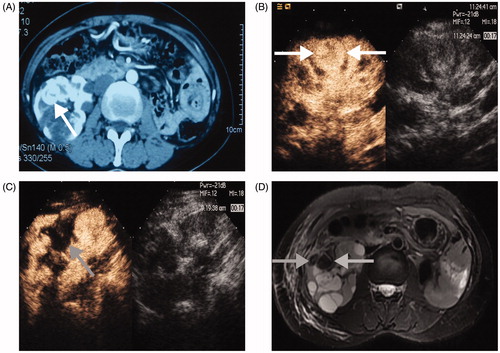
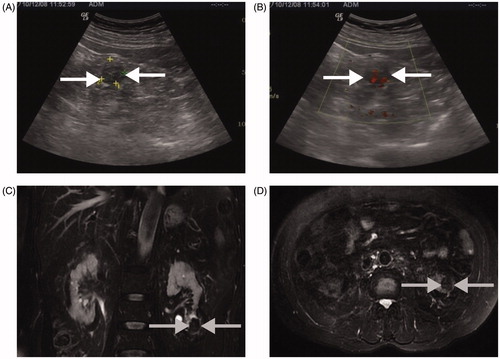
Figure 3. A 2.5 × 2.5 cm tumour lesion in the left kidney of a 76-year-old man treated with MWA. (A and B) A right kidney tumour is detected by conventional US at physical check-up (white arrow); (C and D) Five years after MWA MR image shows no recurrent tumour in the ablation zone (grey arrow).