Figures & data
Figure 1. Schematic drawings of the antenna set-up for both systems and the phantom models applied for simulations.
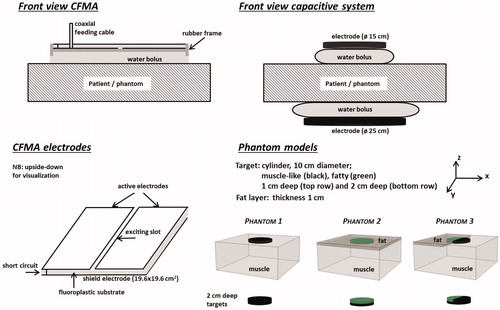
Figure 2. CT scan with the position of the modelled CFMA and capacitive antennas, for a recurrent breast cancer patient model. The contour represents the target delineation.
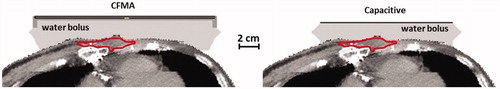
Table 1. Values of the dielectric properties at 13.56 MHz and 434 MHz used in the simulations; conductivity (σ [S m − 1] and relative permittivity (ɛr [−]).
Table 2. Values of the density and thermal properties used in the simulations; density (ρ [kg m − 3]), specific heat capacity (c [J kg − 1 °C − 1]), thermal conductivity (k [W m − 1 °C − 1]) and perfusion (Wb [kg m − 3 s − 1]).
Figure 3. Relative SAR profiles at the surface (phantom 1 and 2) and directly under the fat layer (phantom 2) along the lines x = 0 and y = 0 through the centre. SAR distributions were normalised to 100% at the maximum value anywhere in tissue.
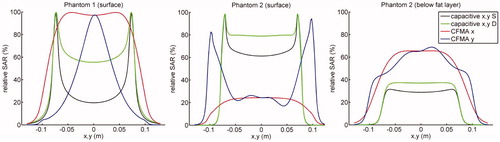
Figure 4. Relative SAR profiles at the surface and directly under the fat layer for phantom 3 along the lines x = 0 and y = 0 through the centre. The top row shows the profiles for the radiative CFMA and the bottom row for capacitive heating. The fat layer covers the part of the phantom with negative x-coordinates. SAR distributions were normalised to 100% at the maximum value anywhere in tissue.
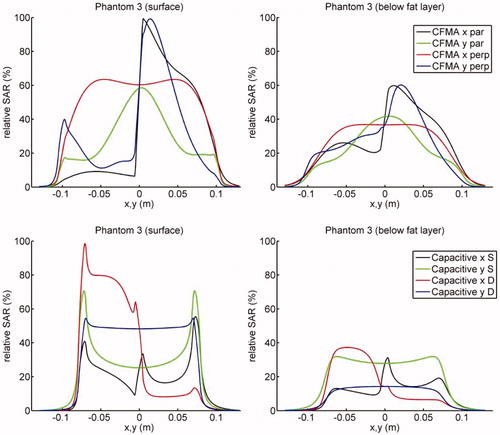
Figure 5. Percentage of the target volume with a SAR value above 50% of the SAR maximum in the phantom, for the three different phantom configurations.
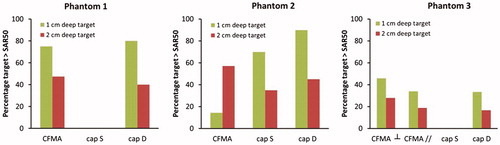
Figure 6. Indexed temperatures T10, T50 and T90 for the phantom models, assuming a 1 cm deep target (top row) and a 2 cm deep target (bottom row). The total absorbed power was scaled such that the maximum temperature was 44 °C.
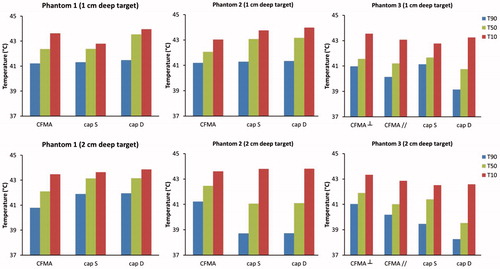
Figure 7. Temperature volume histograms of the delineated target region in a recurrent breast cancer patient. The delineated region was assigned muscle-like tissue properties (left), fatty tissue properties (centre) or heterogeneous tissue properties (right) as derived from the CT Hounsfield Units. A deionised water bolus bag for capacitive heating is indicated with “D”, a saline bolus with “S”. For radiative heating with a 4H CFMA, two orientations were modelled: the electric field oriented in cranial–caudal (CC) and in left–right (LR) direction. The total absorbed power was scaled such that the maximum temperature was 44 °C.
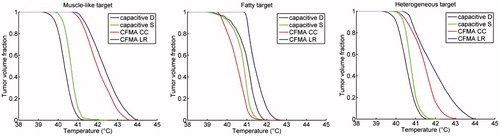
Figure 8. Indexed target temperatures T10, T50 and T90 simulated for a recurrent breast cancer patient. The delineated region was assigned muscle-like tissue properties (left), fatty tissue properties (centre) or heterogeneous tissue properties (right) as derived from the CT Hounsfield units. A deionised water bolus bag for capacitive heating is indicated with “D”, a saline bolus with “S”. For radiative heating with a 4H CFMA, two orientations were modelled: the electric field oriented in cranial–caudal (cc) and in left–right (lr) direction. The total absorbed power was scaled such that the maximum temperature was 44 °C.
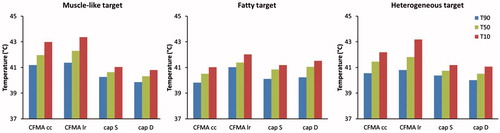
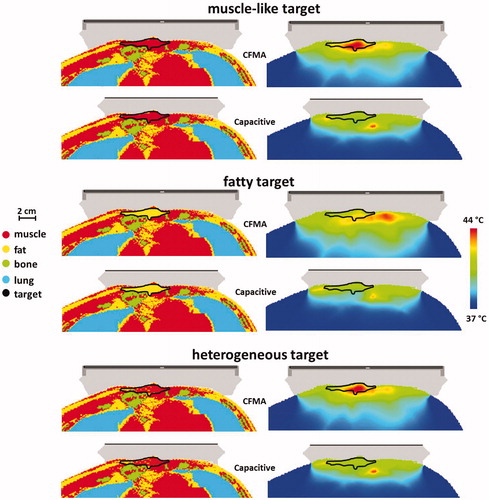
Figure 9. Simulated temperature distributions for capacitive and radiative heating for a patient anatomy, assuming a homogeneous muscle-like target, a homogeneous fatty target or a heterogeneous target with tissue types assigned based on the Hounsfield Units of the CT scan. For capacitive heating the situation with a saline bolus bag is shown and for radiative heating the CFMA was positioned such that the E-field is in left–right direction. The total absorbed power was scaled such that the maximum temperature was 44 °C.