
Figures & data
Figure 1. Flow chart of the present study. Random assignment was performed using SPSS version 19.0. MLC: metastatic liver carcinoma; TACE: transcatheter arterial chemoembolization; MWA: microwave ablation; RFA: radiofrequency ablation; CRLM: colorectal liver metastases; HCC: hepatocellular carcinoma.
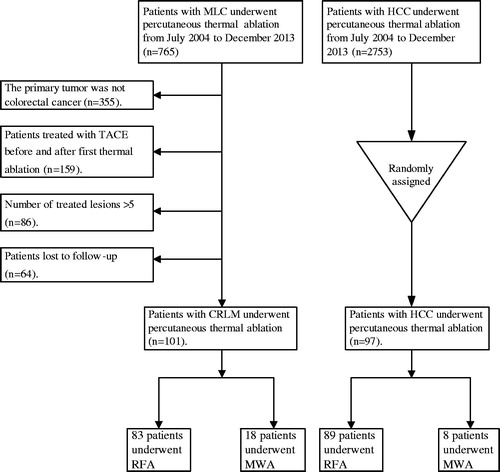
Table 1. Clinical characteristics of CRLM and HCC patients.
Table 2. Comparison of local therapeutic efficacy in the CRLM and HCC groups.
Figure 2. Curves of local tumour progression (LTP), calculated by the Kaplan–Meier method, according to tumour size (≤ 3 cm/> 3 cm). (a) The log-rank test demonstrates that over time, the presence of tumour size >3 cm was associated with a significantly higher rate of LTP in the CRLM group (p = 0.002). (b) The log-rank test demonstrates that over time, the presence of tumour size >3 cm was not associated with LTP in the HCC group (p = 0.979).
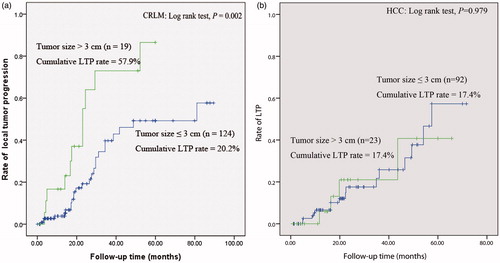
Figure 3. Curves of local tumour progression (LTP), calculated by the Kaplan–Meier method, according to safety margin (≤ 0.5 cm/> 0.5 cm). (a) and (b), The log-rank test demonstrates that over time, the presence of a safety margin ≤0.5 cm was associated with a significantly higher rate of LTP in the CRLM and HCC group (p < 0.001, p = 0.013).
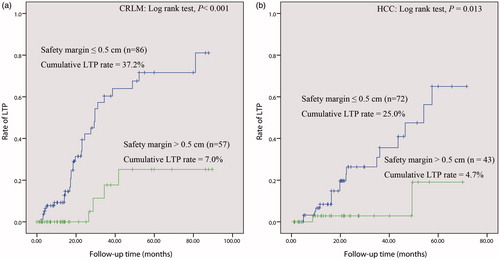
Figure 4. HCC in a 57-year-old patient. (a) The image obtained by CECT before thermal ablation indicates a lesion diameter of 4.1 cm in segment VIII, with hyper-enhancement in the arterial period (arrow). (b) One month after thermal ablation, the ablated area did not exhibit enhancement in CECT (arrow), which confirms complete ablation of the tumour. The diameter of the ablated area was 4.2 cm. We calculated a safety margin of 0 cm. (c) and (d) Approximately 7.1 months after ablation, the arterial phase in CECT revealed nodular hyper-enhancement at the lateral margin of the ablated area, which indicates LTP (arrow); washout of this nodule was observed in the portal venous phase of CECT.
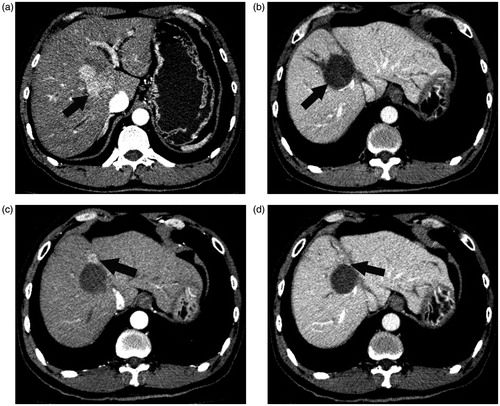
Table 3. Univariate analysis of risk factors for LTP in CRLM and HCC after ablation.
Table 4. Multivariate analysis of risk factors for LTP in CRLM and HCC after ablation.