Figures & data
Table 1. Patient characteristics.
Figure 1. Experimental protocol. HT: hyperthermia therapy; Trec: rectal temperature; BP: blood pressure; PR: pulse rate; SpO2: oxygen saturation of the peripheral artery; BW: body weight.
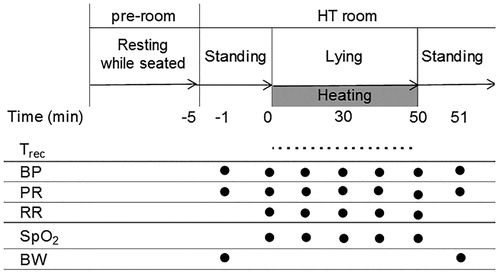
Figure 2. The serial changes in the rectal temperature during HT therapy. n = 31. The data are presented as the mean ± SD, *p < 0.05, **p < 0.01, ***p < 0.001 vs. 0 min.

Figure 3. The serial changes in the (A) PR and (B) blood pressure during HT therapy. n = 31. The data are presented as the mean ± SD, **p < 0.01, ***p < 0.001 vs. 0 min. (C) The individual changes of the systolic and diastolic blood pressure on standing after HT. n = 31. ΔSBP means the difference value of SBP between the end of HT on recumbent position and upright position after HT. ΔDBP means the difference value of DBP between the end of HT on recumbent position and upright position after HT.
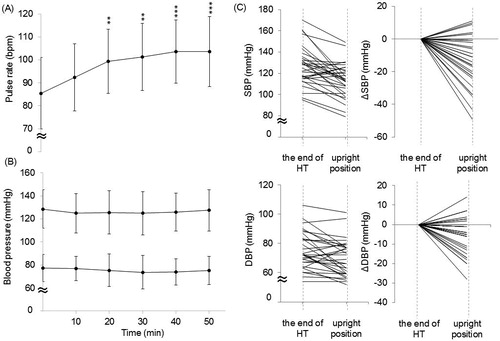
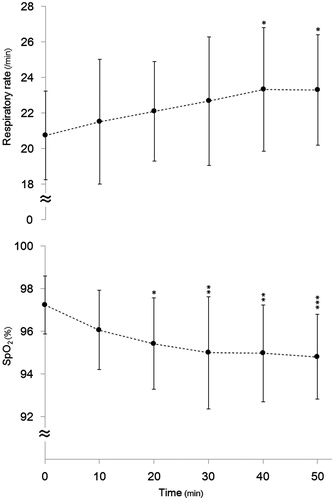
Figure 4. The serial changes in the (A) RR and (B) SpO2 during HT therapy. n = 31. The data are presented as the mean ± SD, *p < 0.05, **p < 0.01, ***p < 0.001 vs. 0 min.