Figures & data
Figure 1. General outline of the treatment planning process.
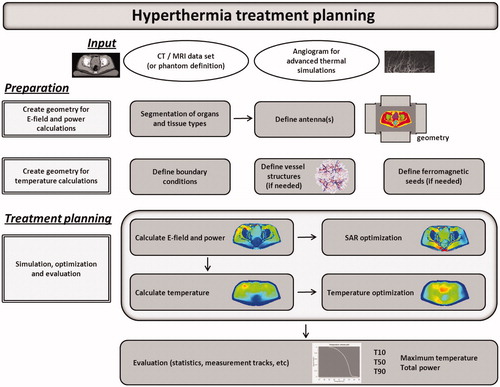
Figure 2. The process of creating a geometry for E-field and absorbed power calculations for phantom or patient simulations.
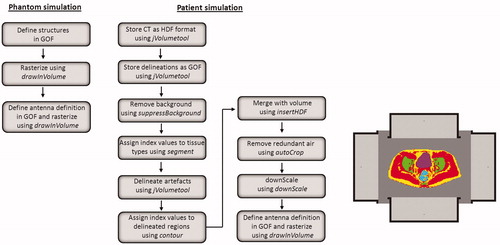
Figure 3. Transversal and sagittal slices of the CT scan with delineations and the segmented patient anatomy combined with the antenna model for the 70 MHz AMC-8 system, using a single ring of four antennas.
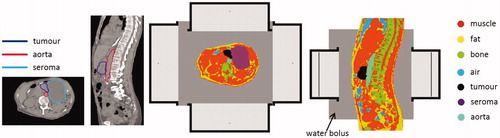
Table 1. Values of the dielectric and thermal properties for different tissue types at 70 MHz, used in the simulations; conductivity (σ [S m−1]), relative permittivity (ɛr [–]), density (ρ [kg m−3]), specific heat capacity (c [J kg−1 °C−1]), thermal conductivity (k [W m−1 °C−1]) and perfusion (Wb [kg m−3 s−1]).
Figure 4. 3D representation of the modelled tumour volume with a 12 dual-electrode implant, together with the initial discrete vasculature (left) and the complete artificially generated detailed vasculature (right).
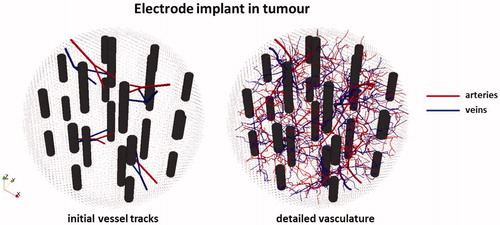
Table 2. Values of the dielectric and thermal properties for different tissue types at 27 MHz, used in the simulations; conductivity (σ [S m−1]), relative permittivity (ɛr [–]), density (ρ [kg m−3]), specific heat capacity (c [J kg−1 °C−1]), thermal conductivity (k [W m−1 °C−1]) and perfusion (Wb [kg m−3 s−1]).
Figure 5. Simulated temperature distributions for heating of a pancreatic cancer patient with the AMC-8 locoregional hyperthermia system using standard clinical phase-amplitude settings, SAR-based optimised phase-amplitude settings and temperature-based optimised phase-amplitude settings.
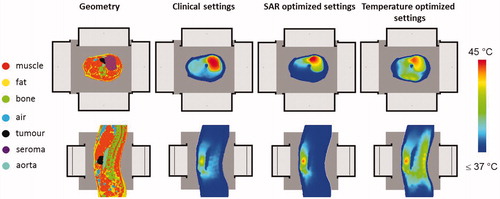
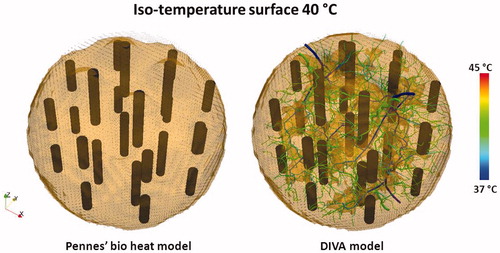
Figure 6. Opaque iso-temperature surface of the simulated temperature distribution for the 12 dual electrode implant in , resulting from the Pennes’ bio heat model and the DIVA model. The picture for the DIVA model also shows the temperature distribution in the vasculature, responsible for the cold tracks where the temperature remains below 40 °C.