
Figures & data
Figure 1. A RFA device was used to cauterise along the future transection plane. A 2-cm-wide avascular area was established between the FLR and contralateral lobe.
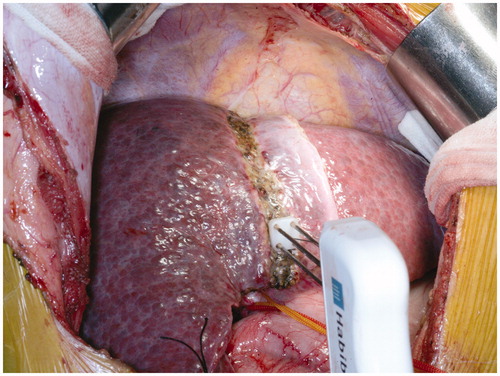
Figure 2. Contrast-enhanced computer tomography (CT) on day 28 after stage I of RALPPS depicted a clear avascular area between the diseased hemiliver and FLR, which was formed by RFA (white arrow).
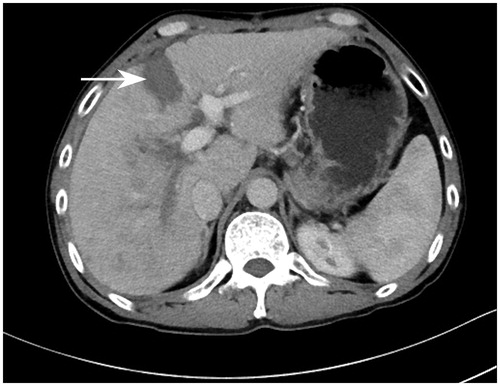
Table 1. Clinical characteristics of patients undergoing RALPPS.
Table 2. Postoperative morbidity and mortality of RALPPS.
Table 3. Postoperative liver function parameters after each stage of RALPPS.
Table 4. Volumetric changes of the FLR and intraoperative data.
Figure 3. During stage II of RALPPS, the peritoneal inflammatory response decreased and adhesions were few because the liver was not mobilised in stage I.
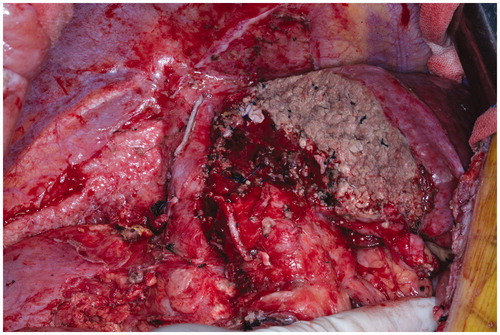
Table 5. Literature review.