Figures & data
Figure 1. Tumour growth curves after various treatments. Combined therapy (RT + TT) has resulted in longer tumour growth delay (∼10 days) than the radiotherapy (RT, ∼4.5 days) or the GdIONP-mediated thermotherapy (TT, ∼2.5 days) only. TRAMP-C1 cells (1 × 10⁶) were injected intramuscularly into the tights of male C57BL/6 J mice. Mice with a palpable tumour of approximately 60 mm3 in volume were randomly separated into four groups (n = 5) and were given two times intratumour injections of GdIONP or saline before thermotherapy. Mice were anaesthetised before treatments. For the control and RT group, 0.05 ml saline alone was injected. For TT and RT + TT group, 1 mg GdIONP prepared in 0.05 ml saline was injected. TT group were subjected to induction heating at 52 kHz and 246 Oe. In the end of each experiment, mice were sacrificed and the tumours were excised and weighed.
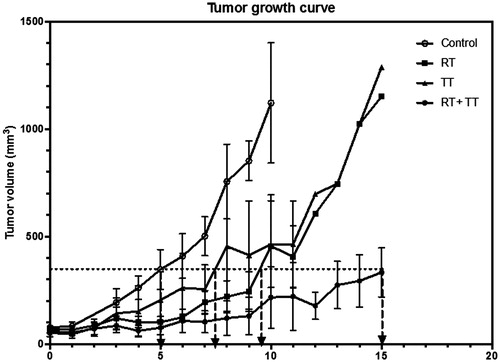
Figure 2. (A) The retention of GdIONPs in the TRAMP-C1 tumour shown by T1 and T2-weighted MR imaging taken at different times. The injected GdIONPs were remained in the TRAMP-C1 tumours (highlighted by the yellow outline) for 10, 30, and 50 min. (B) The temperature distribution profile changes across heating time measured by a thermocouple needle at the GdIONP injection site. The thermotherapy was conducted by an induction heating at an external alternating magnetic field (AMF, 52 kHz and 246 Oe) for 40 min. Mice were injected with PBS (AMF only) or GdIONP (AMF + NP) under external alternating magnetic field (AMF). (C) The simulated temperature distribution within tumour. The tumour temperature decreased by 1.5-°C for every 2 mm away from the TT core.
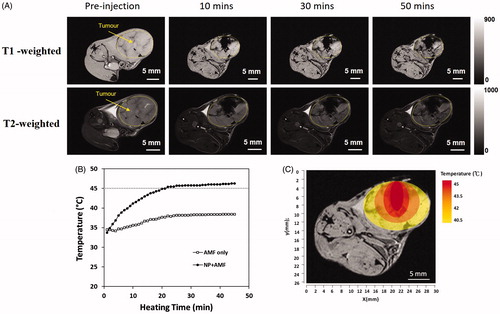
Figure 3. H & E and PIMO staining of tumour of control (A and C) and thermotherapy (B and D) one day (A and B) and one week (C and D) after treatment. The percentage of necrosis (E) and hypoxia (F) of the control and thermotherapy (TT)-treated TRAMP-C1 tumours at day 1 and week 1 after TT. The largest cross section of the TRAMP-C1 tumour was used to normalise the necrosis and hypoxia areas. Necrosis region were delineated by the yellow outlines. The pimonidazole (PIMO) was administrated i.v. injection for detecting hypoxia. Bars indicate the SE of 3–5 tumours at each time point. The hypoxia fraction was defined as the area positive of pimonidazole divided by the total tumour area (necrosis excluded). *p < .05.
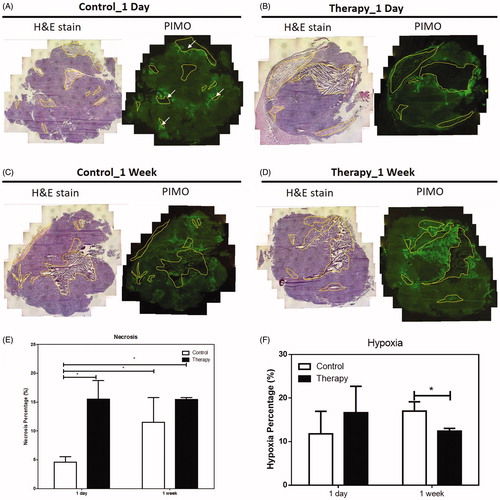
Figure 4. (A) The distribution of necrosis denoted by N, hypoxia stained by PIMO (green colour), and vasculature stained by CD31 (red colour) in control and TT treated TRAMP-C1 tumours at one day and one week after treatment. The scale bar equals 100 μm (B) The change of MVD in hypoxic and nonhypoxic regions of the control and TT-treated TRAMP-C1 tumours at day 1 and week 1 after TT is shown as a bar graph. MVD was defined by the percentage of CD31 + area to the total tumour in field of view. The Bars indicate the SE of measurements from five fields (non-necrotic areas) of 3–5 tumours for each time point.
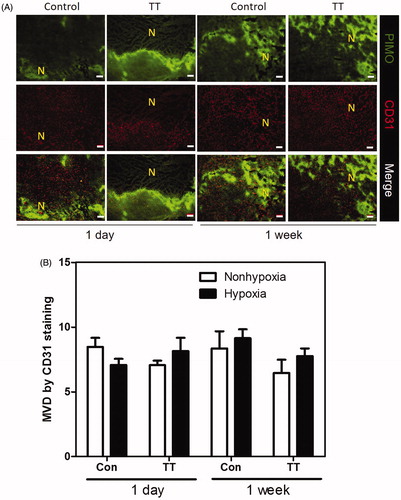
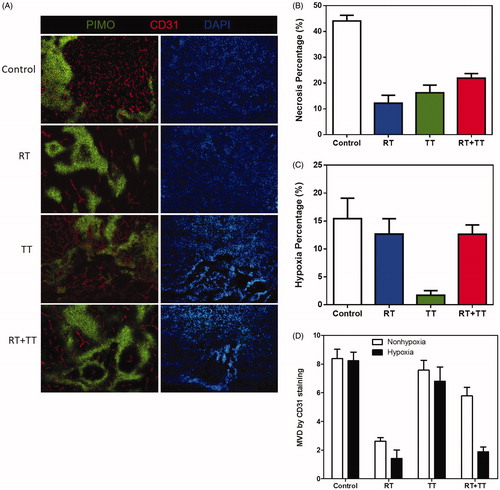
Figure 5. (A) hypoxia (green), vasculature (red), and nuclei (blue) areas revealed by immunofluorescence staining for the control (10 days), RT (15 days), TT (15 days), and combined therapy (15 days) treated TRAMP-C1 tumours. The change of (B) necrosis, (C) hypoxia and (D) MVD in hypoxic and nonhypoxic regions of control and TT-treated tumours were represented using a bar graph. There was almost no vasculature in the hypoxia regions of irradiated tumours (RT and combined therapy). Bar: SE of five fields (non-necrotic areas) of 3–5 tumours for each time point.