
Figures & data
Table 1. Patients’ demographic data and information of nodules.
Figure 1. (A) Transverse image from a 29-year-old woman who received RFA for a benign thyroid nodule 4 months previously. The index nodule volume was 21.1 mL. At the centre of the nodule, the ablated area was seen as a hypoechoic area (Va, arrows). At the margin of the nodule, the incompletely treated viable portion showed an isoechoic area (Vv). The volumes at 4 months were Vt = 7.4 mL, Va = 2.1 mL and Vv = 5.3 mL. (B) Transverse image at the 7-month follow-up. The Vt decreased to 5.3 mL whereas the Vv increased to 5.2 mL. (C) Transverse image at the 21-month follow-up. The Va decreased and nearly disappeared. The Vt increased to 12.4 mL through an increase in the Vv (12.3 mL). (D) Colour Doppler US image showing increased vascularity in the viable area of the nodule.
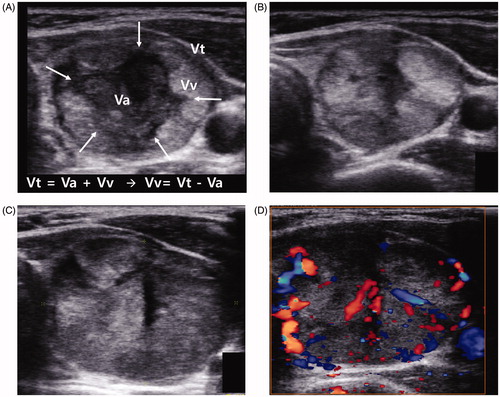
Figure 2. Changes in the Vt, Va and Vv. The Vt and Va showed a declining slope during follow-up, whilst the Vv showed relatively still.
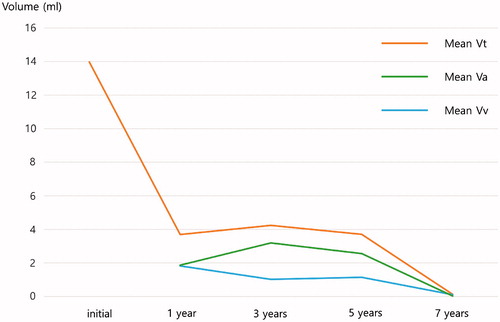
Figure 3. Comparison of the amount of Vv increase and Vt increase. The peak timing of Vv increase was 1 year after RFA. Regrowth started to occur after 1 year and occurred most frequently at 2–4 years after RFA. The mean timing of regrowth was 39.9 ± 17.5 months after RFA.
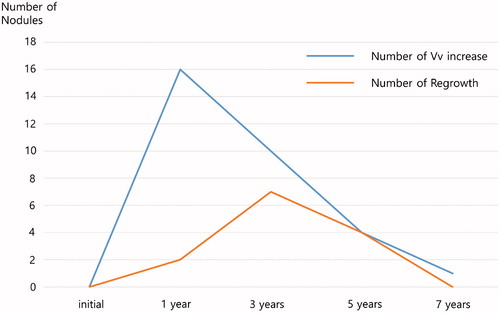
Table 2. Nodule volume changes according to the follow-up period.
Table 3. Complications and side effects.