Figures & data
Figure 1. Flow diagram of patient selection.
Table 1. Demographic and baseline clinical characteristics of patients in the two groups.
Table 2. Procedure details of patients in the two groups.
Table 3. Complications of procedures in the two groups.
Figure 2. Overall survival curves in patients with unresectable MBO who underwent RFA-stent and stent. Data were obtained with Kaplan–Meier method. (A) Whole study population (RFA-stent group: n = 50, median OS = 5.0 months; stent group: n = 39, median OS = 4.7 months; p = 0.068). (B) Patients in cholangiocarcinoma subgroup (RFA-stent group: n = 25, median OS = 6.7 months; stent group: n = 14, median OS = 4.5 months; p = 0.307). (C) Patients in non-cholangiocarcinoma subgroup (RFA-stent group: n = 25, median OS = 7.3 months; stent group: n = 25, median OS = 5.3 months; p = 0.137).
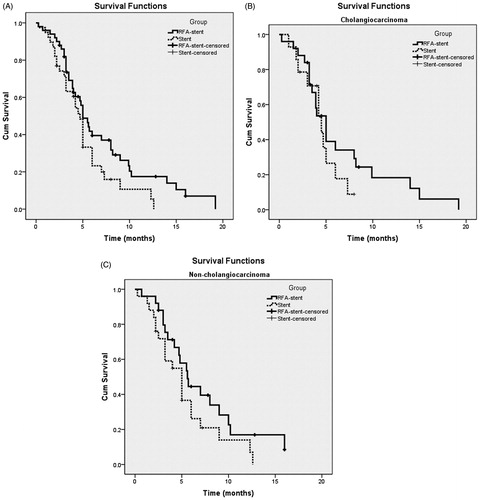
Figure 3. Graph shows PSP for patients with unresectable MBO who underwent RFA-stent and stent. Data were obtained with Kaplan–Meier method. (A) Whole study population (RFA-stent group: n = 50, median PSP = 7.0 months; stent group: n = 39, median PSP = 5.0 months; p = 0.006). (B) Patients in cholangiocarcinoma subgroup (RFA-stent group: n = 25, median PSP =7.6 months; stent group: n = 14, median PSP = 4.3 months; p = 0.009). (C) Patients in non-cholangiocarcinoma subgroup (RFA-stent group: n = 25, median PSP = 6.3 months; stent group: n = 25, median PSP = 5.2 months; p = 0.266).
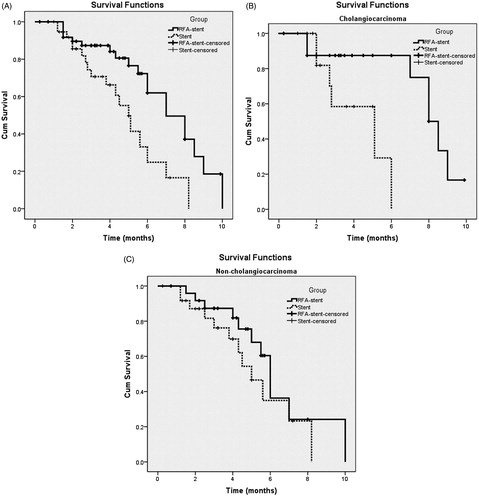
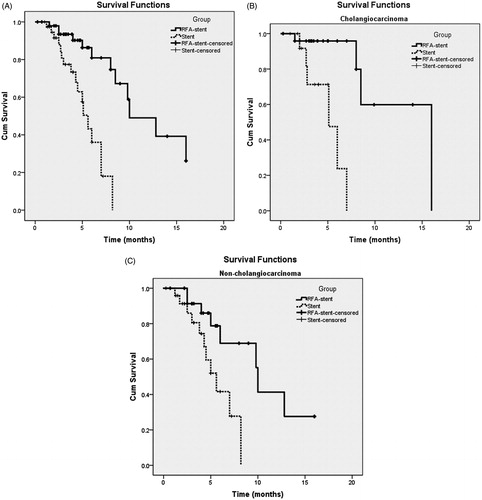
Figure 4. Graph shows SSP for patients with unresectable MBO who underwent RFA-stent and stent. Data were obtained with Kaplan–Meier method. (A) Whole study population (RFA-stent group: n = 58, median SSP = 10.0 months; stent group: n = 39, median SSP = 5.6 months; p < 0.001). (B) Patients in cholangiocarcinoma subgroup (RFA-stent group: n = 25, median SSP =12.6 months; stent group: n = 14, median SSP = 5.0 months; p < 0.001). (C) Patients in non-cholangiocarcinoma subgroup (RFA-stent group: n = 25, median SSP = 10.3 months; stent group: n = 25, median SSP = 5.5 months; p = 0.013).