Figures & data
Table 1. PCR primers used for quantitative RT-PCR.
Figure 1. Effects of clinically relevant hypothermia and hyperthermia on canonical Wnt-3a signalling capacity. (A–E) SAECs were incubated at 32, 37 or 39.5 °C for 24 h, switched back to 37 °C, treated with 200 ng/ml recombinant human Wnt-3a for 3 h, total RNA was collected and mRNA levels of AXIN2 (A), CCND2 (B), c-Myc (C), MMP2 (D) and MMP7 (E) were measured by qRT-PCR and expressed as fold-change vs. levels in 37 °C cells. (F) HEK293T cells treated similarly and Axin2 mRNA levels were measured. (G) HEK293T cells were co-transfected with TOPFlash or FOPFlash and pRL renila luciferase control plasmid, recovered for 24 h at 37 °C, incubated at 32, 37 or 39.5 °C for 24 h, then activated with 200 ng/ml Wnt-3a for 24 h at 37 °C, and firefly and renilla luciferase measured. Firefly luciferase activity was normalised to renilla activity and the ratio of TOPFlash:FOPFlash calculated and expressed as fold-change vs. 37 °C. Mean ± standard error (SE) of three experiments for qRT-PCR and six experiments for TOPFlash. Asterisk (*) denotes p < 0.05 vs. 37 °C and †p < 0.01 vs. 32 °C.
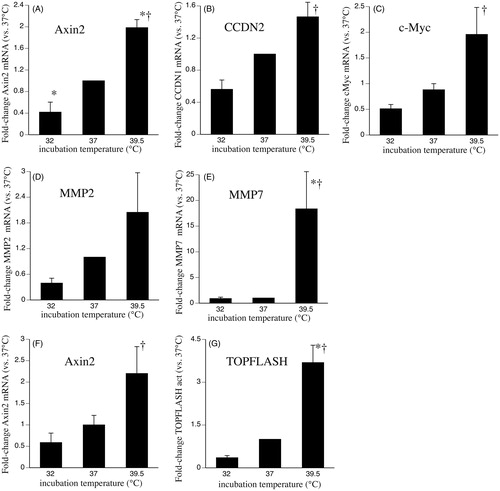
Figure 2. Effects of clinically relevant hypothermia and hyperthermia on cell levels and distribution of TCF7 and β-catenin. (A) SAECs were incubated at 32, 37 or 39.5 °C for 24 h and whole-cell lysate was immunoblotted for β-catenin, TCF7 and ß-tubulin. The band densities were quantified, normalised to ß-tubulin band density and expressed as fold-change vs. 37 °C. A representative immunoblot and a graph summarising the mean ± standard error (SE) of four experiments is shown. (B) SAECs grown on chamber slides were incubated at 32, 37 or 39.5 °C for 24 h and either fixed (left panels) or switched back to 37 °C and stimulated with 200 ng/ml Wnt-3a for 3 h and fixed. The fixed monolayers were immunostained for β-catenin (red) and DAPI (blue) and analysed by confocal immunofluorescence microscopy. Representative fields from three similar experiments are shown. (C) HEK293T cells were transfected with either inhibitors (inh) or mimics (mim) of the three temperature-responsive miRNAs (miR ×3), scrambled sequence controls for each (cnt) or nothing (−), recovered for 24 h, incubated at the indicated temperature for 24 h, then stimulated with 200 ng/ml Wnt-3a at 37 °C for 3 h and Axin2 mRNA levels were measured by qRT-PCR and expressed as fold-change vs. unstimulated 37 °C cells. Mean ± SE of three experiments. Asterisk (*) and dagger (†) denote p < 0.05 vs. unstimulated 39.5 °C and mimic-pre-treated cells, respectively.
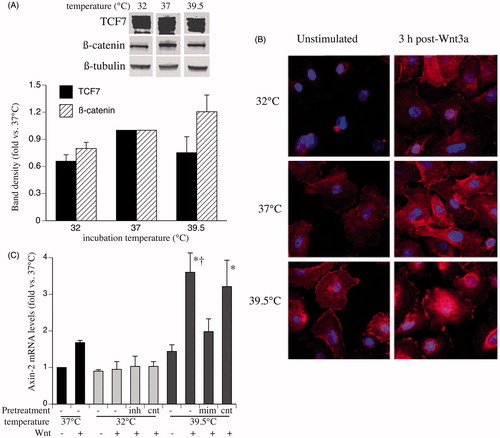
Table 2. Pathways targeted by a representative temperature sensitive miRNA hsa-miR-92a-1–5pTable Footnotea.
Table 3. Wnt-signalling genes targeted by temperature-sensitive miRNAsTable Footnotea.
Figure 3. Effect of temperature-dependent Wnt signalling on genes involved in EMT and fibrosis. SAECs were incubated at 32, 37 or 39.5 °C for 24 h and total RNA was collected for analysis of basal EMT gene expression (A) or the cells were stimulated with 200 ng/ml Wnt-3a for 24 h at 37 °C and total RNA collected for analysis of Wnt-3a-stimulated gene expression (B–D). Type I collagen-α (COL1A1) (B), ratio of N-cadherin (CDH-2) to E-cadherin (CDH-1) (C) and TWIST1 (D) were quantified by qRT-PCR and expressed as fold-change vs. unstimulated 37 °C cells. Mean ± standard error (SE) of four experiments are shown. Asterisk (*) denotes p < 0.005 vs. 37 °C and †p < 0.02 vs. 32 °C.
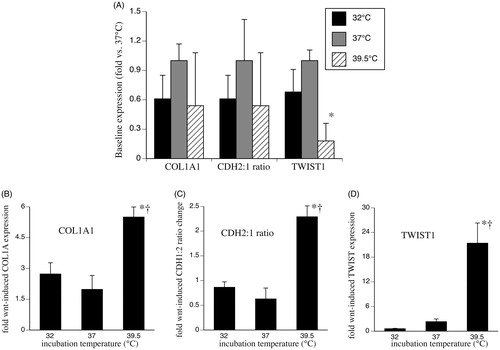
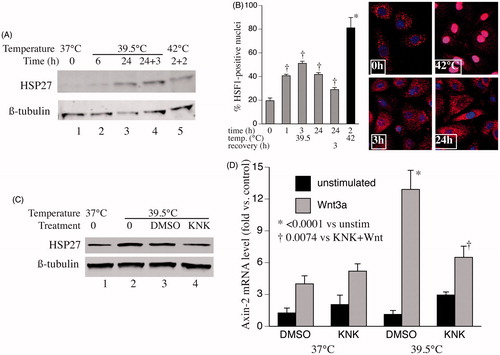
Figure 4. Contribution of HSF1 to hyperthermia-enhanced Wnt-signalling capacity. (A) SAECs were incubated at 39.5 °C for 6 or 24 h, 39.5 °C for 24 h then 37 °C for 3 h, or 42 °C for 2 h then 37 °C for 2 h. Cells were lysed and immunoblotted for HSP27 and ß-tubulin (representative of three similar blots). (B) SAECs were grown on cover slips and incubated at 39.5 °C for 0, 1, 3 or 24 h, at 39.5 °C for 24 h then 37 °C for 3 h, or 42 °C for 2 h. Cells were fixed, immunostained for HSF1 and DAPI, and imaged by confocal immunofluorescence. Representative images for 0, 3 and 24 h at 39.5 °C and 2 h at 42 °C. Percent of cells with nuclear HSF1 staining calculated and mean ± standard error (SE) from three experiments shown. Dagger (†) denotes p < 0.009 vs. time 0, *p < 0.0001 vs. all other treatments. (C) SAECs were pre-treated for 30 min with nothing (0), vehicle (1% DMSO) or 30 μM KNK437 then incubated at 39.5 °C for 24 h, lysed and immunoblotted for HSP27 and ß-tubulin (representative of three similar blots). (D) SAECs were pre-treated with DMSO or 30 μM KNK437 for 30 min, then at 37 or 39.5 °C for 24 h, then with or without 200 ng/ml Wnt-3a for 3 h. Cells were lysed, total RNA collected and axin mRNA quantified by qRT-PCR and expressed as percent of untreated 37 °C control cells. Mean ± SE of six experiments. Asterisk (*) denotes p < 0.0001 vs. all unstimulated cells; †p = 0.007 vs. DMSO-treated, Wnt-stimulated 39.5 °C cells.