Figures & data
Figure 1. Mean ablation zone volumes in resting porcine skeletal muscle at increasing thermal accelerant concentrations.
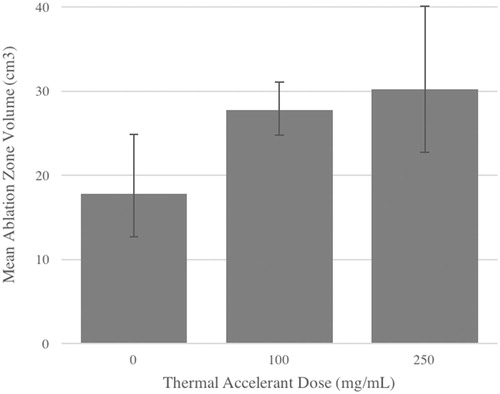
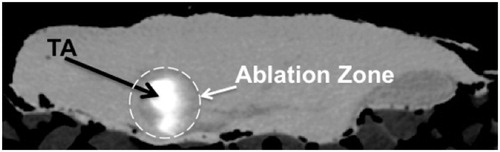
Figure 2. Gross tissue sections of porcine skeletal muscle following in vivo microwave ablation with and without 1 ml thermal accelerant at the 250 mg/mL dose. Ablation with TA (right) yielded a significantly larger ablation zone than without TA (left). Each grid measures 1 cm2.
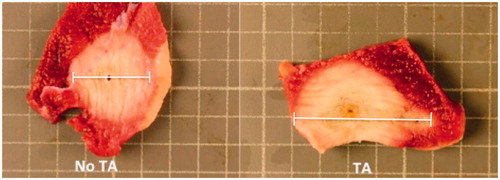
Figure 3. Mean ablation zone volumes in porcine liver at increasing thermal accelerant concentrations.
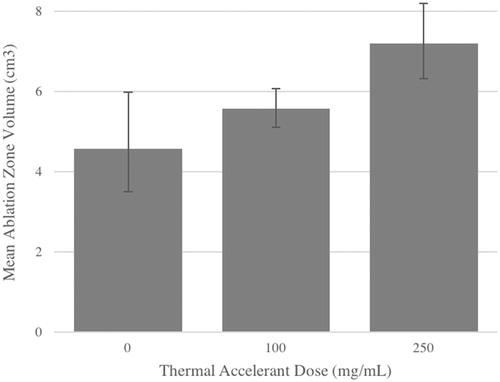
Figure 4. Gross tissue sections of porcine liver following in vivo microwave ablation with and without 1 ml thermal accelerant at the 250 mg/mL dose. Ablation with TA (left) yielded a significantly larger ablation zone than without TA (right). Note the visible TA injection mark (white arrow). Each grid measures 1 cm2.
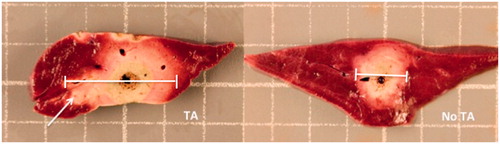
Table 1. Mean ablation zone volume estimates by tissue type and thermal accelerant concentration.
Table 2. Effect of thermal accelerant concentration on mean ablation zone volume by concentration interval.
Figure 5. Schematic of ablation zone anatomy by triphenyltetrazolium chloride staining following microwave ablation.
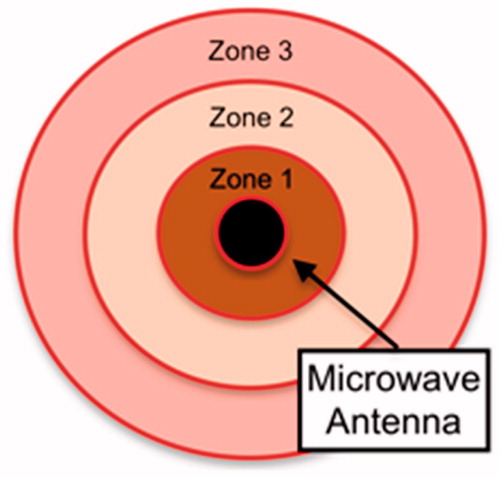
Figure 6. H&E-stained section of porcine liver following in vivo microwave ablation with and without thermal accelerant. Ablation with TA (left) yielded a larger and more elongated ablation zone than without TA (right). An: antenna; AbT: ablated tissue; HT: healthy tissue; BV: blood vessel; Z: zone. A bar below the tissue image represents 5 mm.
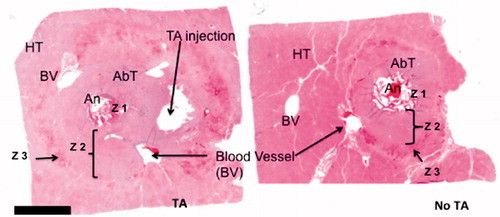
Figure 7. Increased ablation zone volume following in vivo microwave ablation in porcine liver with TA use despite the presence of adjacent large blood vessels. Note the sharp interface between the ablation zone and adjacent hepatic vein in the absence of TA (open white arrows). In contrast, the ablation zone directly abuts and partially encompasses the other adjacent vein with TA administration (black arrow).
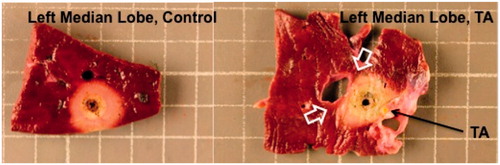
Figure 8. Transverse sonographic image of porcine liver demonstrates heterogeneous shadowing at the site of the microwave antenna. The TA appears moderately echogenic.
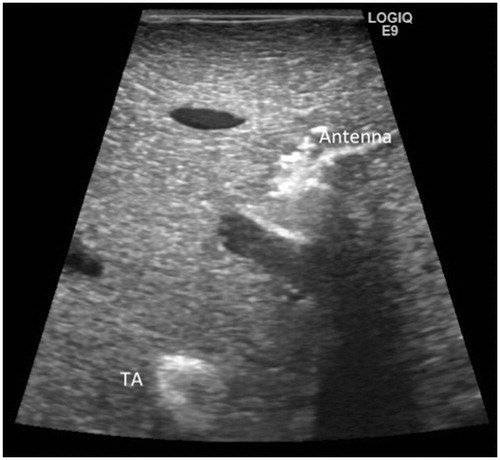
Figure 9. Axial CT image of porcine liver following in vivo microwave ablation. TA can be identified as the hyperattenuating region adjacent to the hypoattenuating ablation zone.