Figures & data
Figure 1. Schematic illustration of the construction of AuNC@PDA-Ax and its biological action. Not to scale.
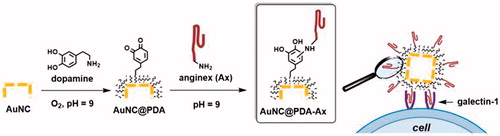
Figure 2. Synthesis and characterisation of PDA layer. (A) Scheme of polymerization (B) LSPR maximum as a function of reaction time. Original spectra can be found in Figure S2; representative TEM images of AuNC@PDA after the reaction had proceeded for different time periods: (C) 0 min, (D) 30 min, (E) 60 min and (F) 90 min.
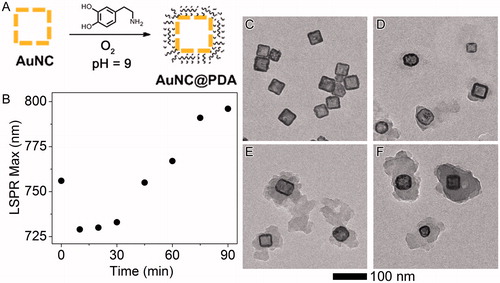
Figure 3. Anginex (Ax) is present on the AuNCs and enables in vitro association with tumour cells. (A) Bound Ax as a function of AuNC@PDA concentration; (B) colloidal stability of AuNC@PDA and AuNC@PDA-Ax in various media; typical darkfield images of 4T1 cells incubated with (C) no treatment, (D) AuNC@PDA, and AuNC@PDA-Ax with (E) ∼ 102 or (F) ∼ 104 Ax/AuNC@PDA, arrows indicate cell-bound particles; and (G) ICP-MS quantification of AuNC per cell following 2 h incubation where the “100 pM + free axe” represents a blocking study using 2:1 ratio of free Ax to particle bound Ax.
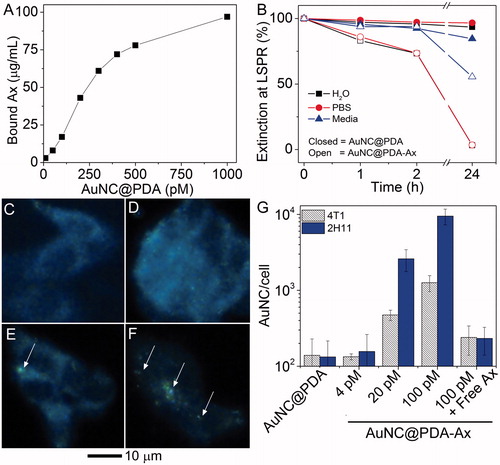
Figure 4. Nanocages have low toxicity alone while only targeted nanocages induce supra-additive photothermal killing and block functional ability of cells to migrate. (A) Viability of (squares) 4T1 and (diamonds) 2H11 in the absence of laser irradiation under increasing (open) AuNC@PDA or (filled) AuNC@PDA-Ax concentrations normalised to untreated cells; (B) cell viability during photothermal experiments for (striped) 4T1 and (solid) 2H11 cell lines normalised to untreated cells; (C) migration assay of 4T1 cells that were (circles) untreated or treated with (triangles) 20 pM AuNC@PDA, (squares) 20 μg/mL Ax, or (diamonds) 20 pM AuNC@PDA-Ax; (D) Representative images of the wound after 72 h, with 0 h traced in white and 48 h traced in red. Viability assays are result of three independent experiments and error bars represent SEM.
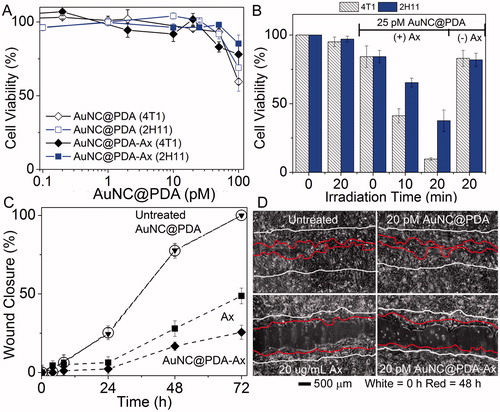
Figure 5. PA flow cytometry reveals strong association of targeted AuNCs with 4T1 tumour cells. (A) Percentage of PA positive cells as a function of incubation time with 25 pM Ax-conjugated AuNCs. (B) Particles bound to cells as a function of washes presented as per cent of AuNC PA signal with simultaneous rhodamine (non-specific cell stain) fluorescence signal.
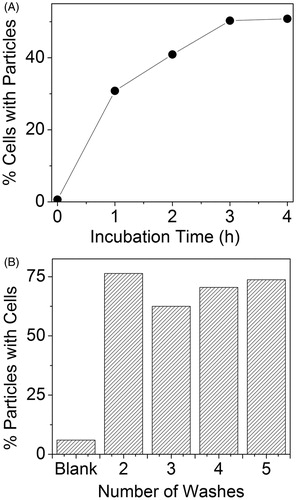
Figure 6. Multimodality imaging of cells and associated nanocages. 4T1 cells were incubated with (A) AuNC@PDA-Ax or (B) AuNC@PDA for 18 h and stained with DAPI. The same area was imaged via (left) PA, (centre) scattering, and (right) fluorescence microscopy arrows in the PA image are used to denote the location of cells; (C) background corrected quantification of photoacoustic signal associated with cells (n = 30), error bars show SEM; and (D) 3 D reconstruction of the PA signal of a typical 4T1 cell incubated with AuNC@PDA-Ax for 2 h demonstrating widespread surface binding of the construct by this time point taken using a 60 × objective.
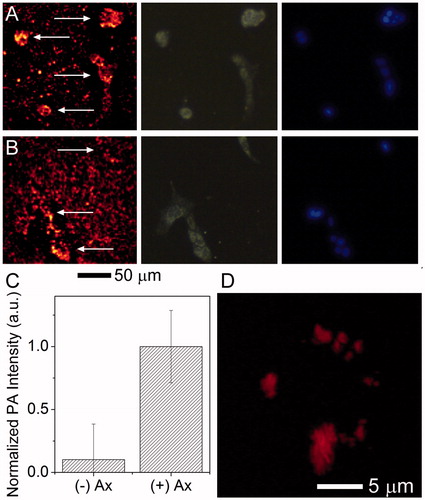
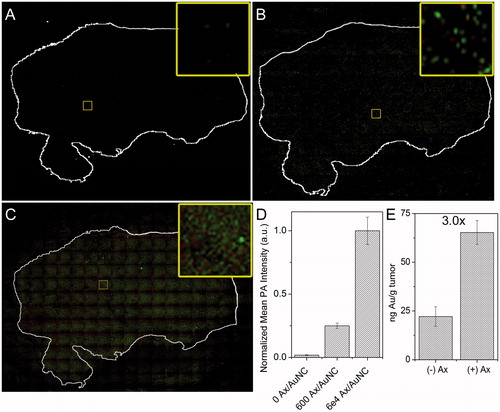
Figure 7. Ex vivo tumour targeting. PA mapping of sequential 4T1 tumour sections from a single tumour stained with either (A) AuNC@PDA, (B) AuNC@PDA-Ax (600 Ax/AuNC), or (C) AuNC@PDA-Ax (60,000 Ax/AuNC) as detected with photoacoustic mapping. Green shows high intensity pixels, red shows low intensity pixels, and black shows no signal. Tumour sections were stained with crystal violet and the outline overlaid and shown in white. Inset shows only the photoacoustic signal from a representative region. (D) Quantification of mean background corrected PA intensity from 20 arbitrary regions within each tumour section. (E) ICP-MS quantification of 4T1 tumour uptake of AuNC@PDA and AuNC@PDA-Ax 24 h after i.v. administration of 0.1 pmol of each preparation.