
Figures & data
Table 1. Characteristics of the 79 patients.
Table 2. Characteristics of the 116 oligometastatic HCCs.
Figure 1. The length of the oligometastatic state and the unoligometastatic state of the 79 patients. The mean length of the oligometastatic state and the unoligometastatic state was 8.3 ± 6.9 months and 25.3 ± 22.6 months, respectively.
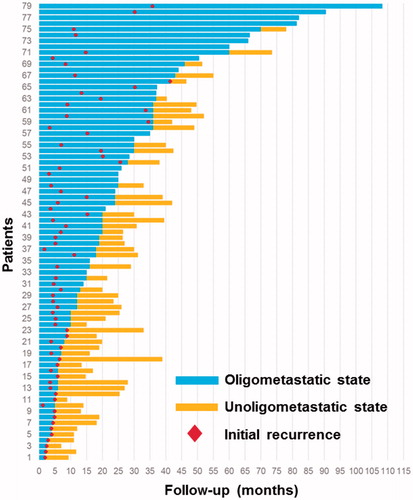
Figure 2. Kaplan–Meier survival curves. (a) Overall survival (OS). (b) Disease-free survival (DFS). (c) Log-rank analysis of OS was stratified according to Child–Pugh score (HR =6.283, p < 0.001). (d) Log-rank analysis of OS was stratified according to the time to unoligometastatic progression (TTUP) (HR =0.136, p < 0.001).
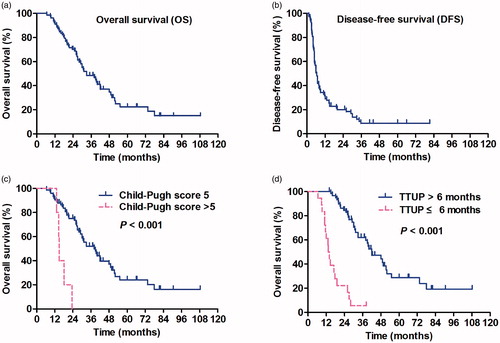
Figure 3. Kaplan–Meier survival curves. (a) Log-rank analysis of DFS was stratified according to the location of oligometastasis in the lung or elsewhere (HR =0.601, p = 0.035). (b) Log-rank analysis of OS was stratified according to the number of oligometastatic organs (HR =1.149, p = 0.734), (c) maximum diameter of oligometastases per patient (HR =1.199, p = 0.175) and (d) the number of oligometastases (HR =1.264, p = 0.388).
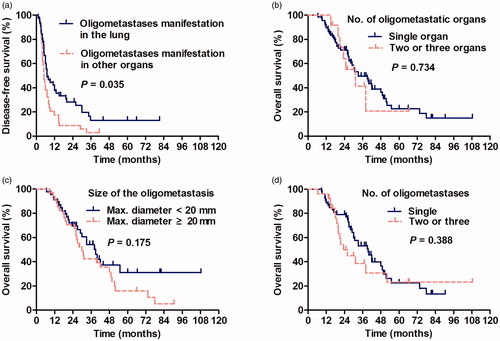
Table 3. Prognostic factors associated with overall and disease-free survival.