Figures & data
Table 1. Maximum likelihood estimates for the parameters of the model in EquationEquation (6)(6) , for the SiHa and HeLa cell lines.
Figure 1. Three different views on the SiHa survival data: survival fraction as a function of radiation dose (left column), temperature (middle column) and time interval (right column). Shown are the mean measured survival (data points) with 95% CI of the mean (error bars) and the model from Equation (7) (lines). Data for the HeLa cell line can be found in the supplementary Figure C1. RT: radiotherapy; HT: hyperthermia.
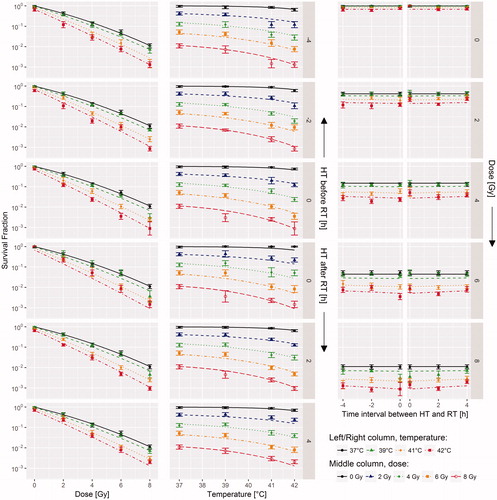
Figure 2. Radiation dose distribution and hyperthermia temperature distribution (left) and resulting equivalent radiation dose (right). Equivalent radiation dose calculation was limited to the GTV only. Temperatures below 37 °C are caused by bolus cooling. For a colour version of this figure, see the online version of this paper.
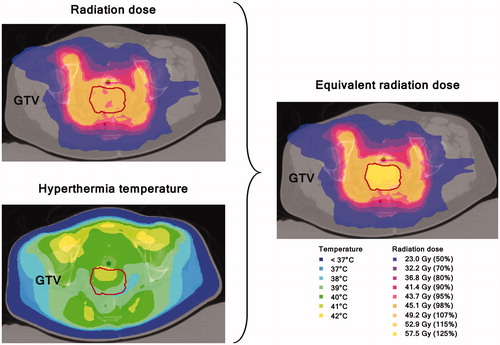
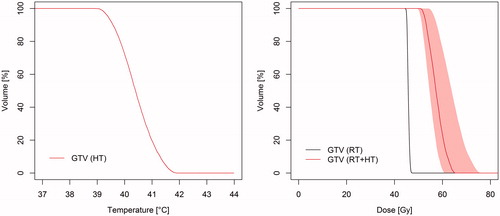
Figure 3. Temperature–volume histogram (left) and dose–volume histogram (right) showing the planned temperature in the GTV during hyperthermia (HT), the planned radiation dose (RT) and the estimated equivalent radiation dose for the combined thermoradiotherapy treatment plan (RT + HT). The equivalent radiation dose is calculated in 2 Gy/fraction using the maximum likelihood estimated parameters for the SiHa cell line (). The shaded region is the 95% CI based on the most extreme EQDRT values produced by the 14 parameter sets that represent the uncertainty in the radiobiological parameters (supplementary Table B2).