
Figures & data
Figure 1. Sagittal view of MRI from a patient with uterine fibroid. (a) Thickness of the subcutaneous fat layer. (b) Thickness of the rectus abdominis. (c) Distance from the anterior surface of the fibroid to the skin. (d) Distance from the posterior surface of the fibroid to the skin.
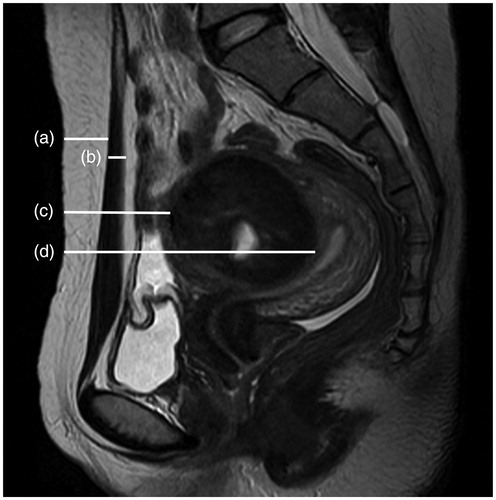
Figure 2. Types of uterine fibroids: (a) submucosal fibroids; (b) subserousal fibroids; (c) intramural fibroids.
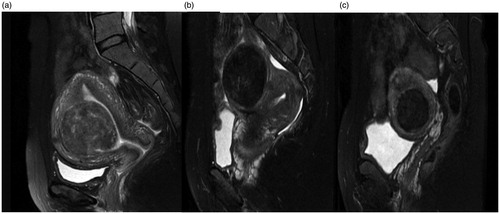
Figure 3. Signal intensity on T2WI. (a) Hypointense fibroid; (b) isointense fibroid; (c) homogeneous-type hyperintense fibroid; (d) heterogeneous-type hyperintense fibroid.
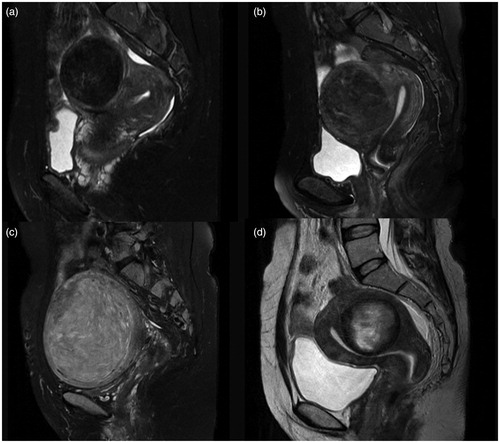
Figure 4. Contrast enhanced MRI from the patients with uterine fibroids. (a) Slight enhancement: the enhancement of the fibroid is less than that of the myometrium; (b) moderate enhancement: the enhancement of the fibroid is similar to the myometrium; (c) significant enhancement: the enhancement of the fibroid is greater than the myometrium.
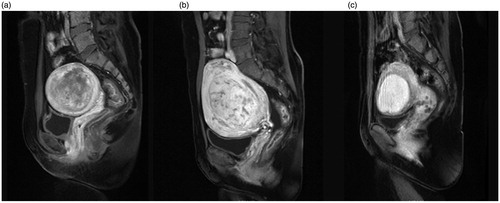
Table 1. Baseline characteristics of patients with uterine fibroids.
Table 2. Treatment results of uterine fibroids treated by USgHIFU.
Figure 5. Quantisation of the signal intensities of uterine fibroids for EEF.
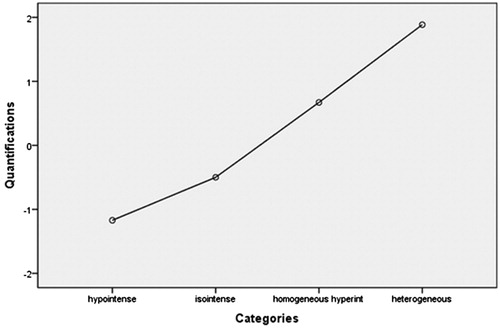
Figure 6. Quantisation of the enhancement types of uterine fibroids for EEF.
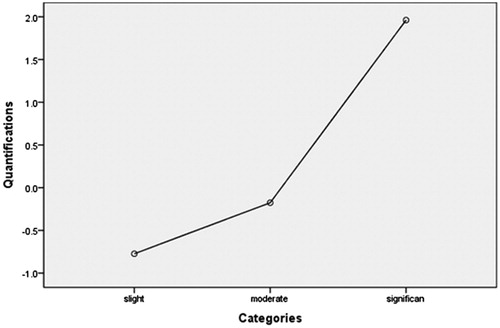
Figure 7. Correlation of EEF distribution and the predict values.
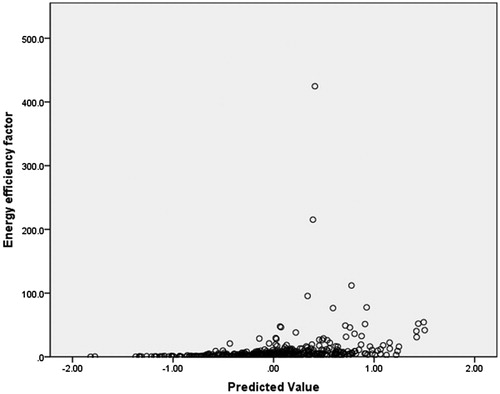
Table 3. Correlation between predictors and EEF.
Table 4. Optimal scaling regression mode of EEF.
Table 5. Optimal scaling level of EEF.
Figure 8. Quantisation of the signal intensities of uterine fibroids for sonication time.
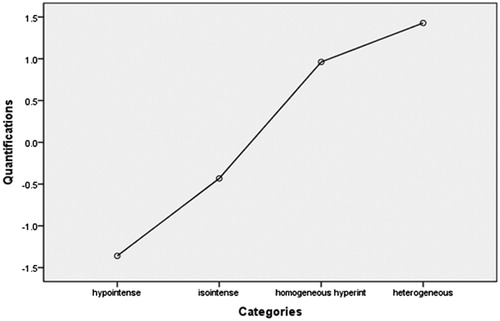
Figure 9. Quantisation of the enhancement types of uterine fibroids for sonication time.
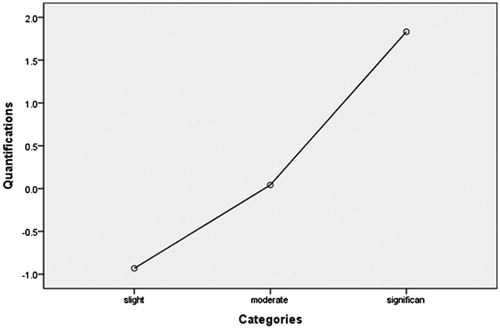
Figure 10. Correlationship between the distribution of sonication time and the predicted values.
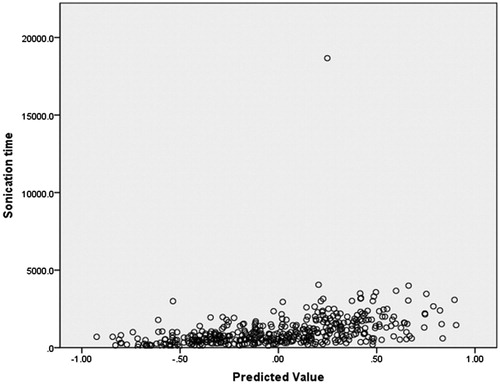
Table 6. Correlation between predictors and sonication time.
Table 7. Optimal scaling regression mode of sonication time.
Table 8. Optimal scaling level of sonication time.