Figures & data
Figure 1. The figure shows the operator’s role in determining the extent of nodule volume reduction using laser light (A) or radiofrequency energy (B).
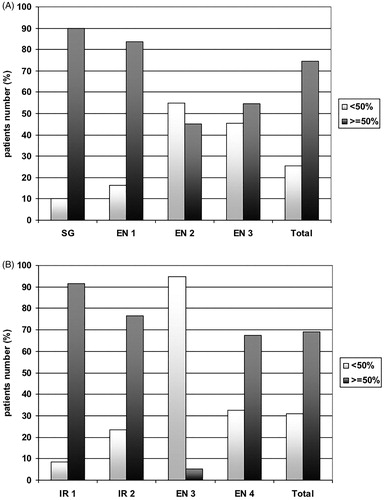
Table 1. Baseline characteristics and results in all study patients according to baseline nodule volume group before propensity score matching.
Table 2. Predictive factors for percentage volume reduction (PVR) at 6th month in all study patients and according to LA or RFA treatment before propensity score matching.
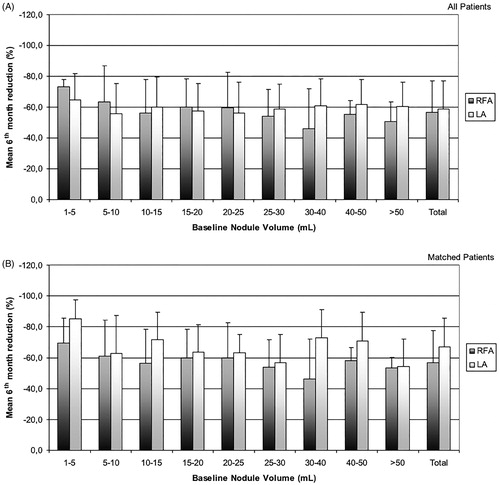
Figure 2. The figure shows the mean nodule reduction at 6 months according to baseline nodule volume group in all patients before (A) and after (B) propensity score adjustment. After propensity score-matching analysis, the higher rate of PVR in LA group in comparison with RFA group, appears confirmed in large nodules (>30 ml) thyroid nodules, appears clearly confirmed.
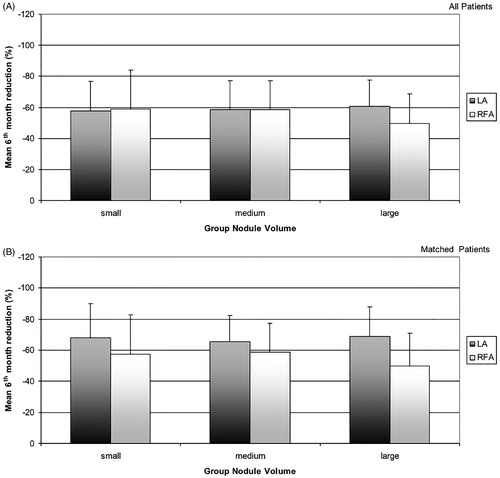
Table 3. Results in all study patients according to baseline nodule volume group after propensity score matching.
Table 4. Major, minor complications and side effects in each group of 138 patients.
Figure 3. The figure shows the wide variability in volume reduction with both the techniques according to baseline nodule volume, both before (A) and after (B) propensity score adjustment.