Figures & data
Table 1. Demographic table and characteristic of lesions.
Figure 1. (a) CT axial slice (low resolution due to the low dose used with Fluoro-CT to reduce the dose), RFA needle inside the lesion (large unfilled arrow), and the bone biopsy needle (arrowhead) used as a guide; (b) core biopsy histology revealing disorganised trabeculae of immature bone consistent with OB (haematoxylin–eosin).
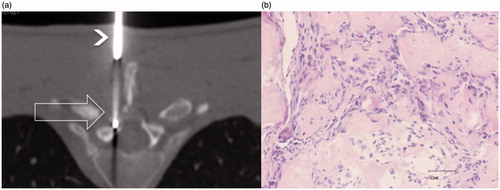
Figure 2. OB (arrow) of the posterior arc of D6: (a) before treatment; (b) follow-up 6 months after treatment showing sclerosis of the lesion; (c, d) follow-up after 24 and 60 months, respectively, showing the slow progression of bone remodelling toward disappearance of the treated lesion.
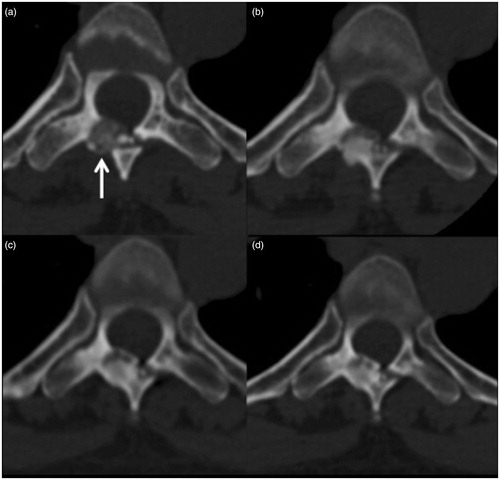
Figure 3. Same case as in : (a) pre- and (b) post-treatment T2 FAT SAT MRI, showing bone oedema around the lesion (arrowheads) and disappearance during follow-up.
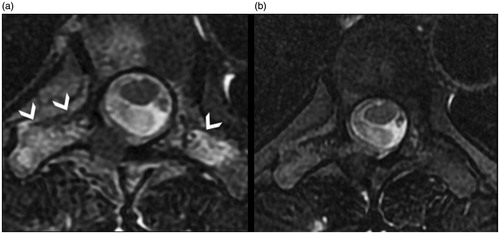
Figure 4. (a) OB of the lamina of D11 (arrow); (b) ossification of the nidus treated (arrow) with the sign of the pathway of the nidus (black arrowhead); (c, d) coronal reconstructions along the plane hatched on the axial images with evidence of ossification of the treated lesion.
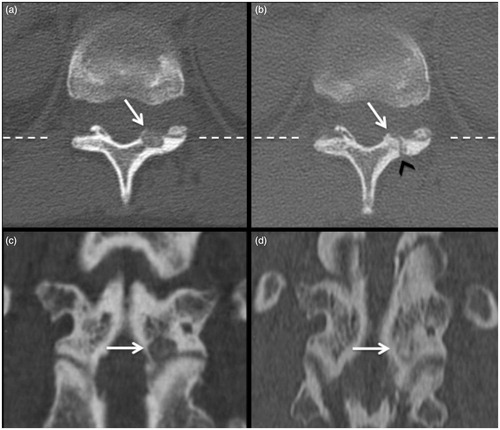
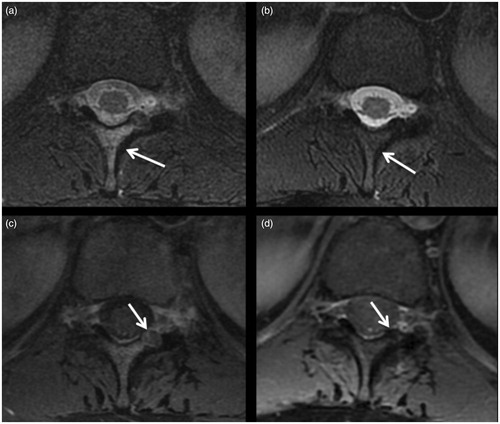
Figure 5. Same case as in : (a) pre- and (b) post-treatment T2 FAT SAT MRI, showing in (a) the presence of bone oedema before treatment, which has disappeared in (b); (c) pre- and (d) post-treatment T1 FAT SAT with C.E., showing disappearance of C.E. in the nidus of the lesion (arrow) after treatment.